
Pen Tablet Market - Global Share, Size & Changing Dynamics 2019-2030
Global Pen Tablet Market is segmented by Application (Design Industry, Architecture, Engineering, Animation, Digital Art), Type (Graphics Tablets, Drawing Tablets, Digital Art Tablets, Stylus Pens, Tablet Monitors), and Geography (North America, LATAM, West Europe, Central & Eastern Europe, Northern Europe, Southern Europe, East Asia, Southeast Asia, South Asia, Central Asia, Oceania, MEA)
Pricing
Report Overview
Industry Overview
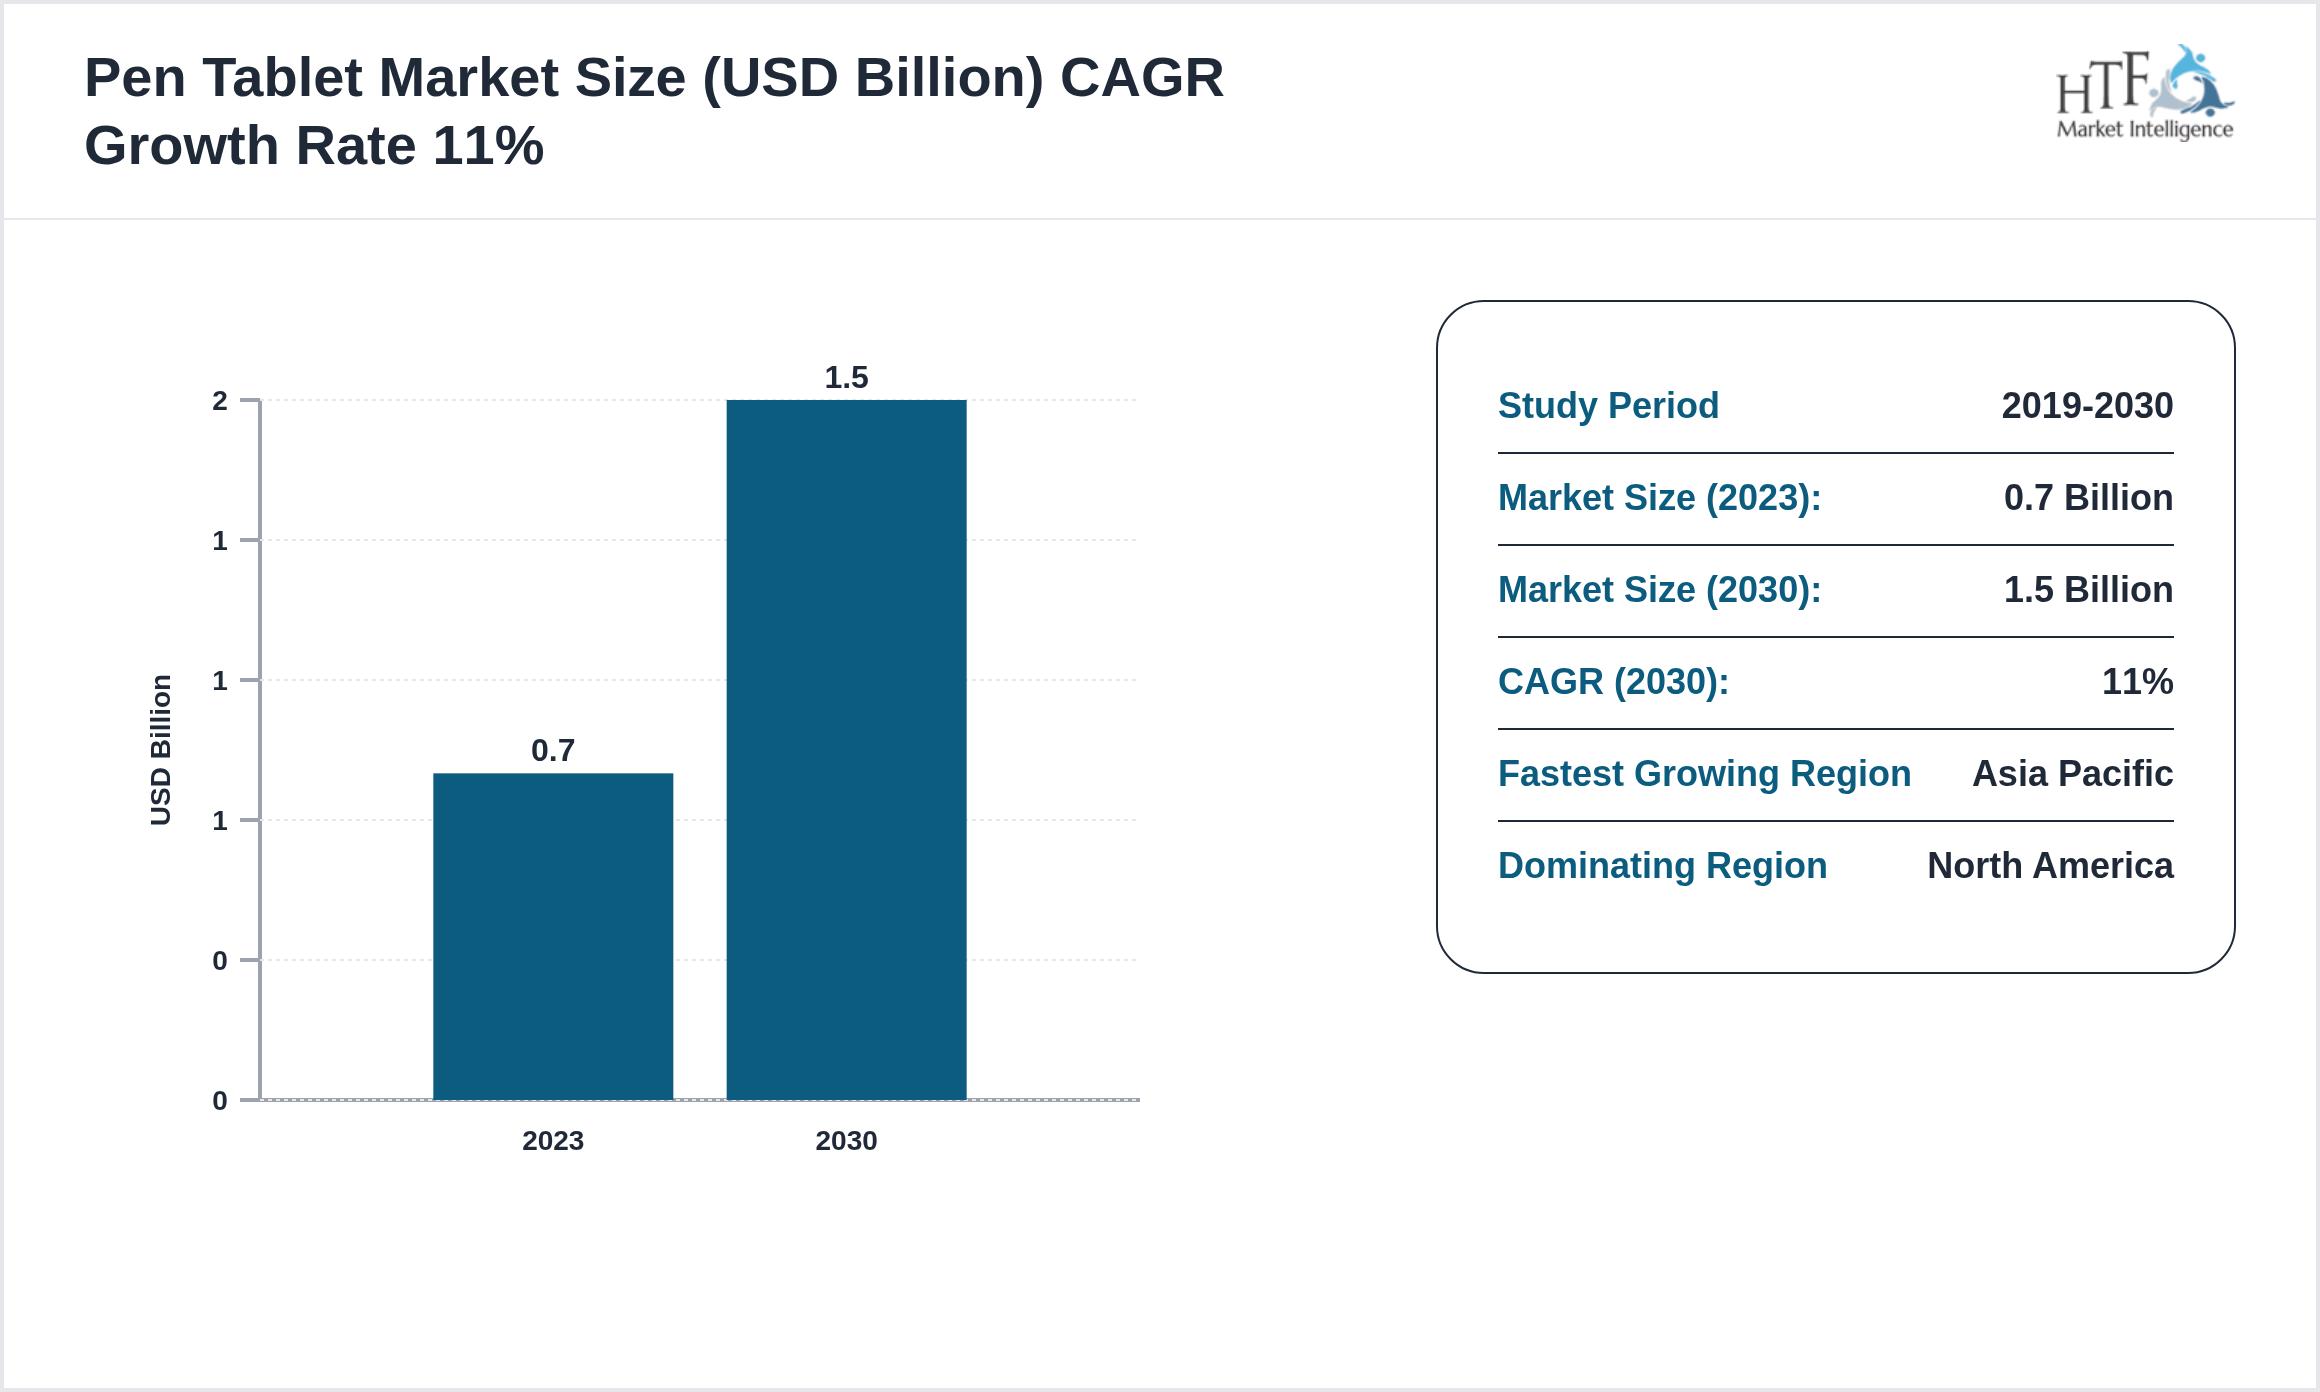
The Pen Tablet market is expected to reach 1.5 Billion by 2030 and is growing at a CAGR of11% between 2023 and 2030.
The Pen Tablet Market involves the development and sale of digital tablets that allow users to draw, write, and interact with digital content using a pen or stylus. These tablets are used in creative fields, including digital art, graphic design, and architecture, as well as for note-taking and academic purposes. The market is driven by the growing need for digital input devices, the rise of digital content creation, and the increasing popularity of stylus-enabled devices in the education and business sectors. Manufacturers are focusing on improving the sensitivity, precision, and ergonomics of pen tablets, while also expanding compatibility with a range of software and devices.
Source: HTF Market Intelligence (HTF MI)
Market Size & Forecast
Market Segmentation
Selecting segmentation criteria in Wacom, Huion, XP-Pen, Ugee, Veikk, Parblo, Apple, Microsoft, Gaomon, Hanvon involves several key steps. Researchers begin by defining their objectives, such as understanding consumer behavior or identifying market opportunities. They then gather relevant data on demographics, psychographics, and buying behavior. Next, they identify segmentation variables like age, location, lifestyle, and purchase patterns. Using analytical tools, they analyze the data to find distinct market segments and evaluate their attractiveness based on size, growth potential, and alignment with business goals. Detailed profiles are created for each segment, and the most promising ones are selected for targeting. Finally, tailored marketing strategies are developed, and the performance of these strategies is monitored and adjusted as needed. This process ensures that segmentation effectively identifies valuable market opportunities and aligns with strategic goals.
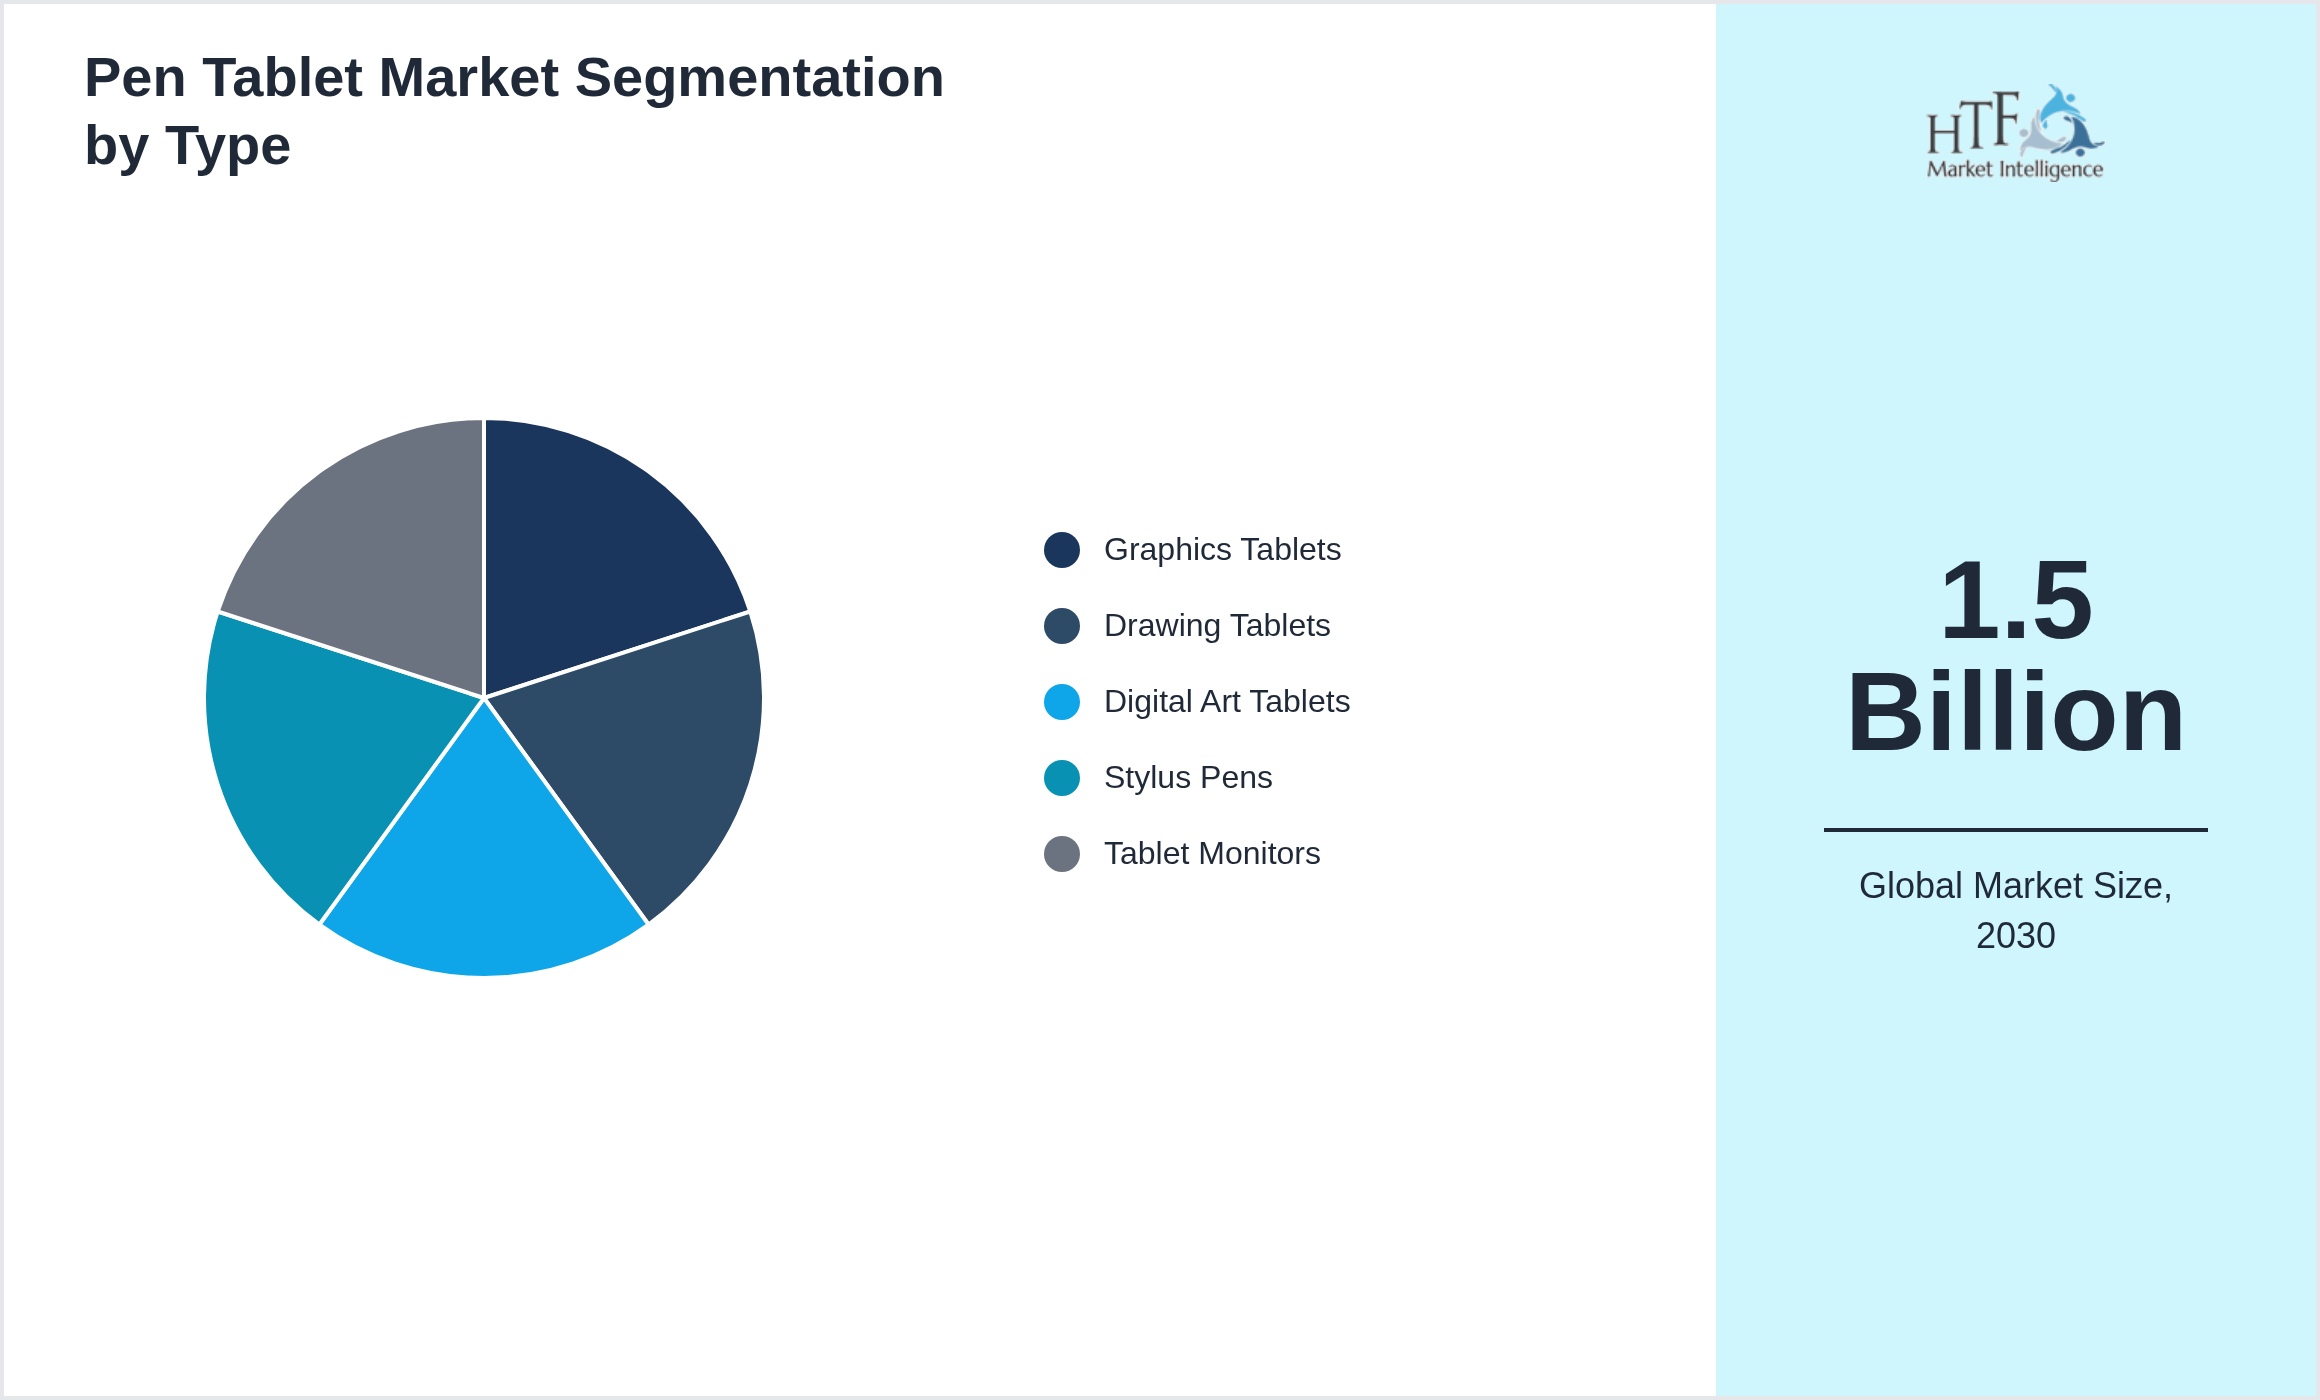
Segmentation by Type
- • Graphics Tablets
- • Drawing Tablets
- • Digital Art Tablets
- • Stylus Pens
- • Tablet Monitors
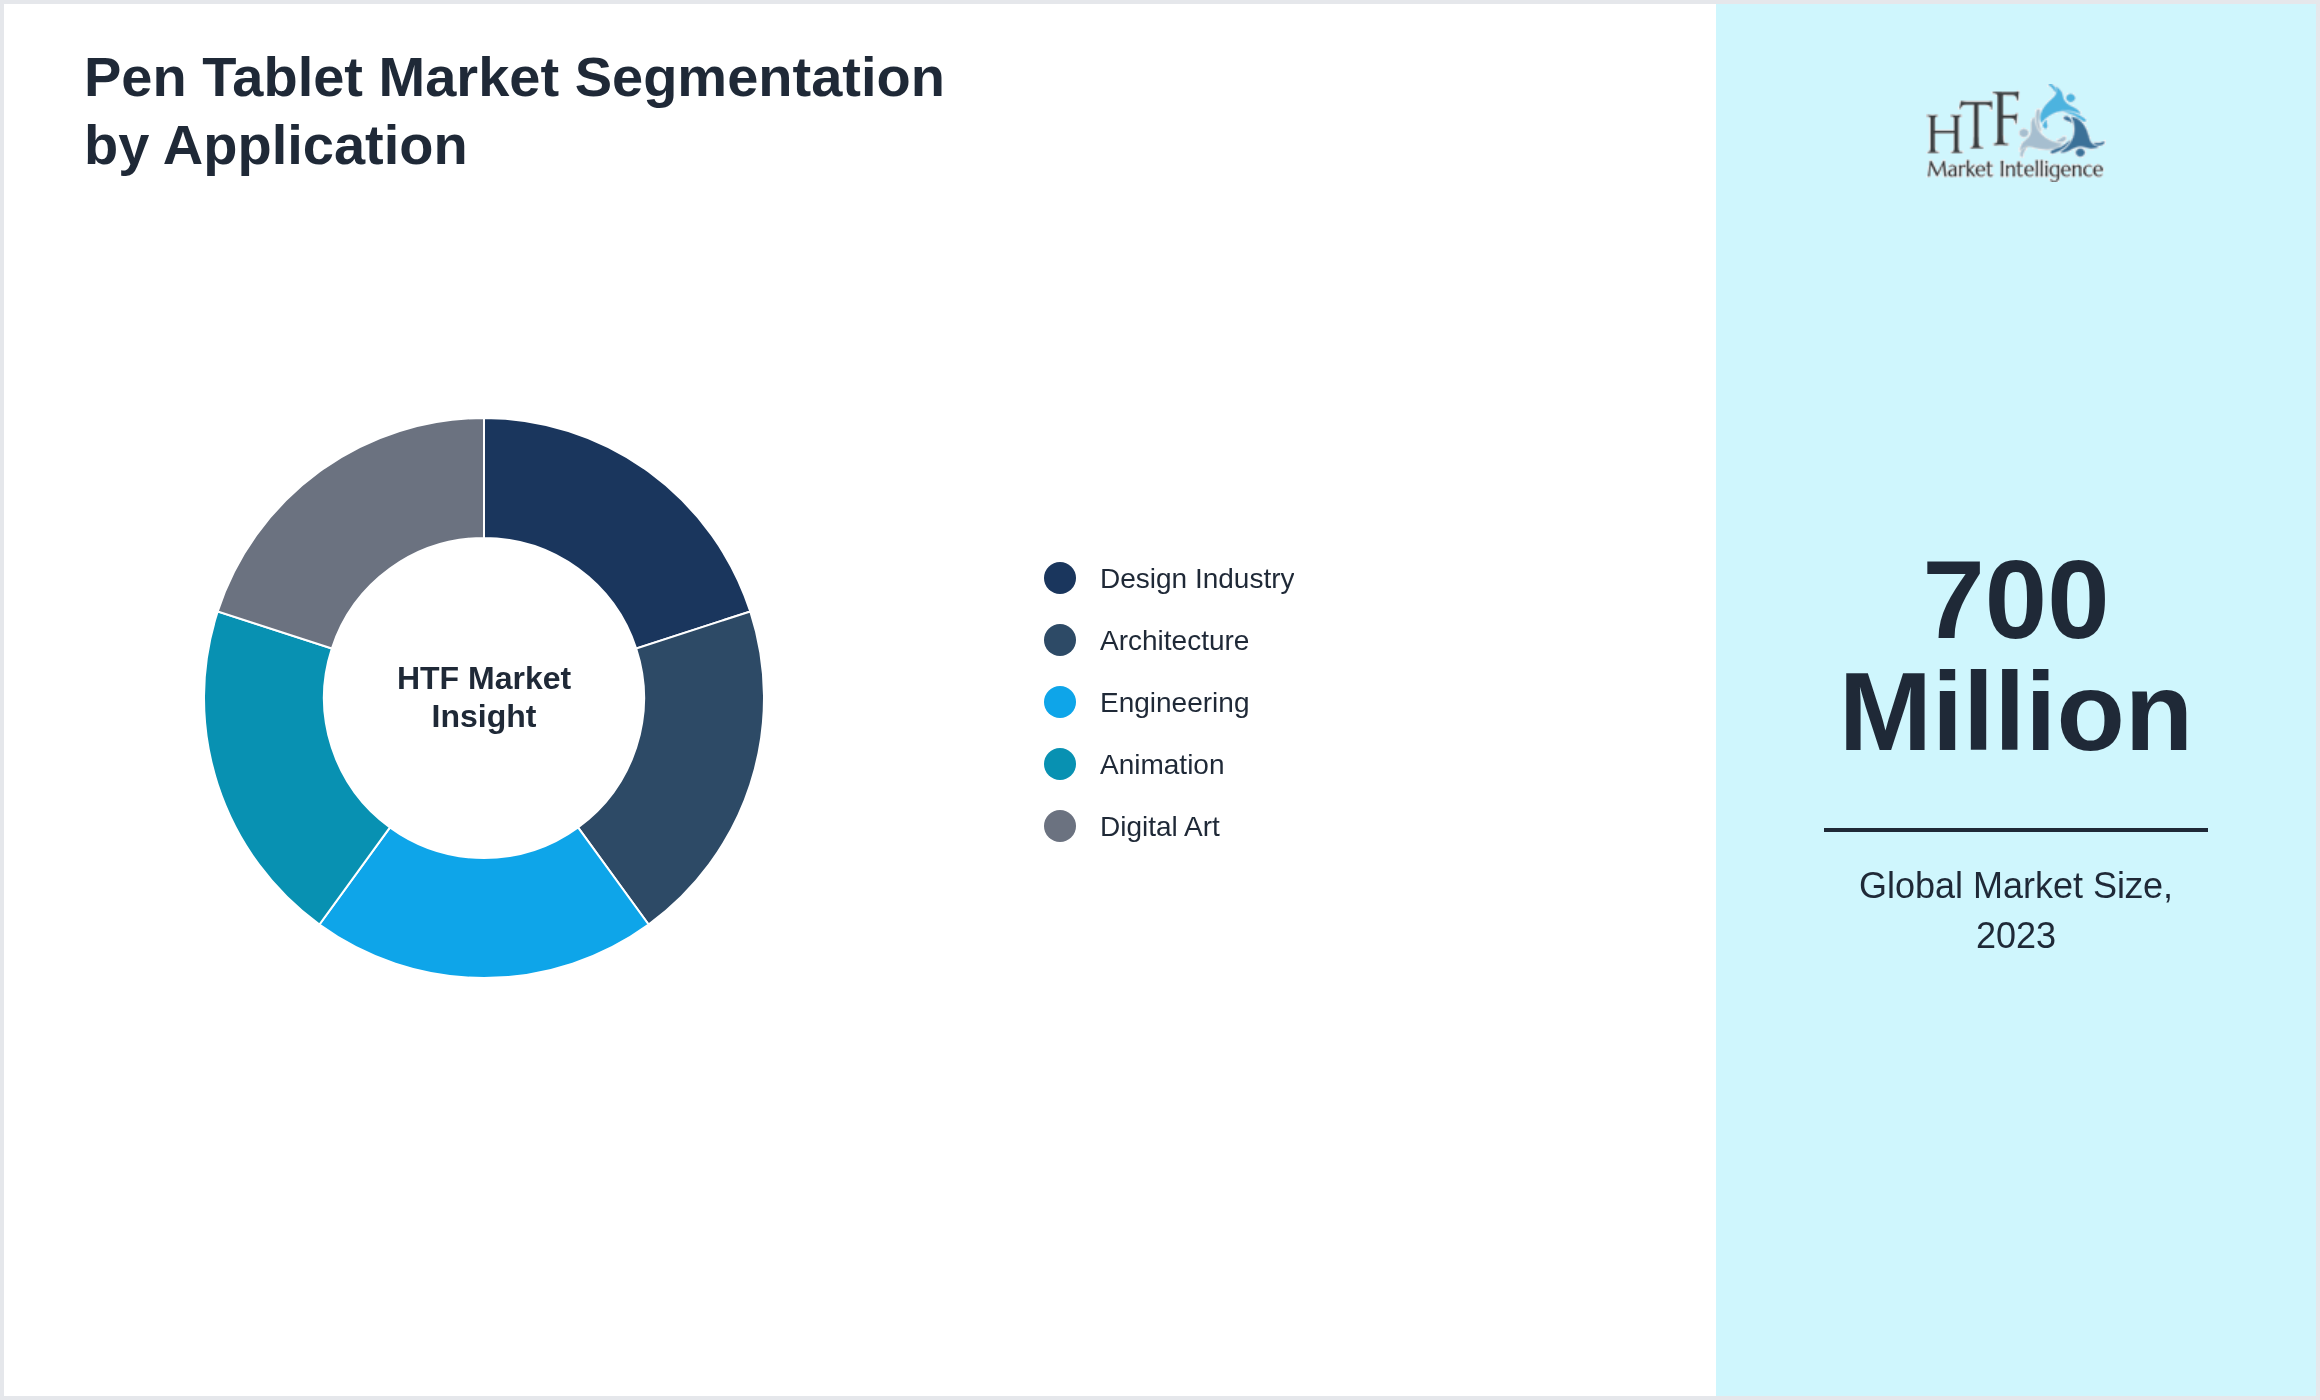
Segmentation by Application
- • Design Industry
- • Architecture
- • Engineering
- • Animation
- • Digital Art
Pen Tablet Market Dynamics
ThePen Tablet is driven by factors such as increasing demand in end-use industries, technological advancements, research and development (R&D), economic growth, and increasing global trade.
Influencing Trend:
- • High-Precision Input
- • Ergonomic Design
- • Customizable Features
- • Emerging Markets
- • Specialized Tablet Applications
- • Customization
- • High Cost of Advanced Tablets
- • Technical Complexity
- • Limited Compatibility
- • Emerging Markets
- • Specialized Tablet Applications
- • Customization
Regional Insight
The North Americaregion holds a dominant market share, primarily driven by growing consumption patterns, a rising population, and robust economic activity that fuels market demand. Meanwhile, the Asia Pacific Region is experiencing the fastest growth, propelled by increasing infrastructure developments, expanding industrial activities, and a surge in consumer demand, positioning it as a key driver for future market expansion.
- North America
- LATAM
- West Europe
- Central & Eastern Europe
- Northern Europe
- Southern Europe
- East Asia
- Southeast Asia
- South Asia
- Central Asia
- Oceania
- MEA
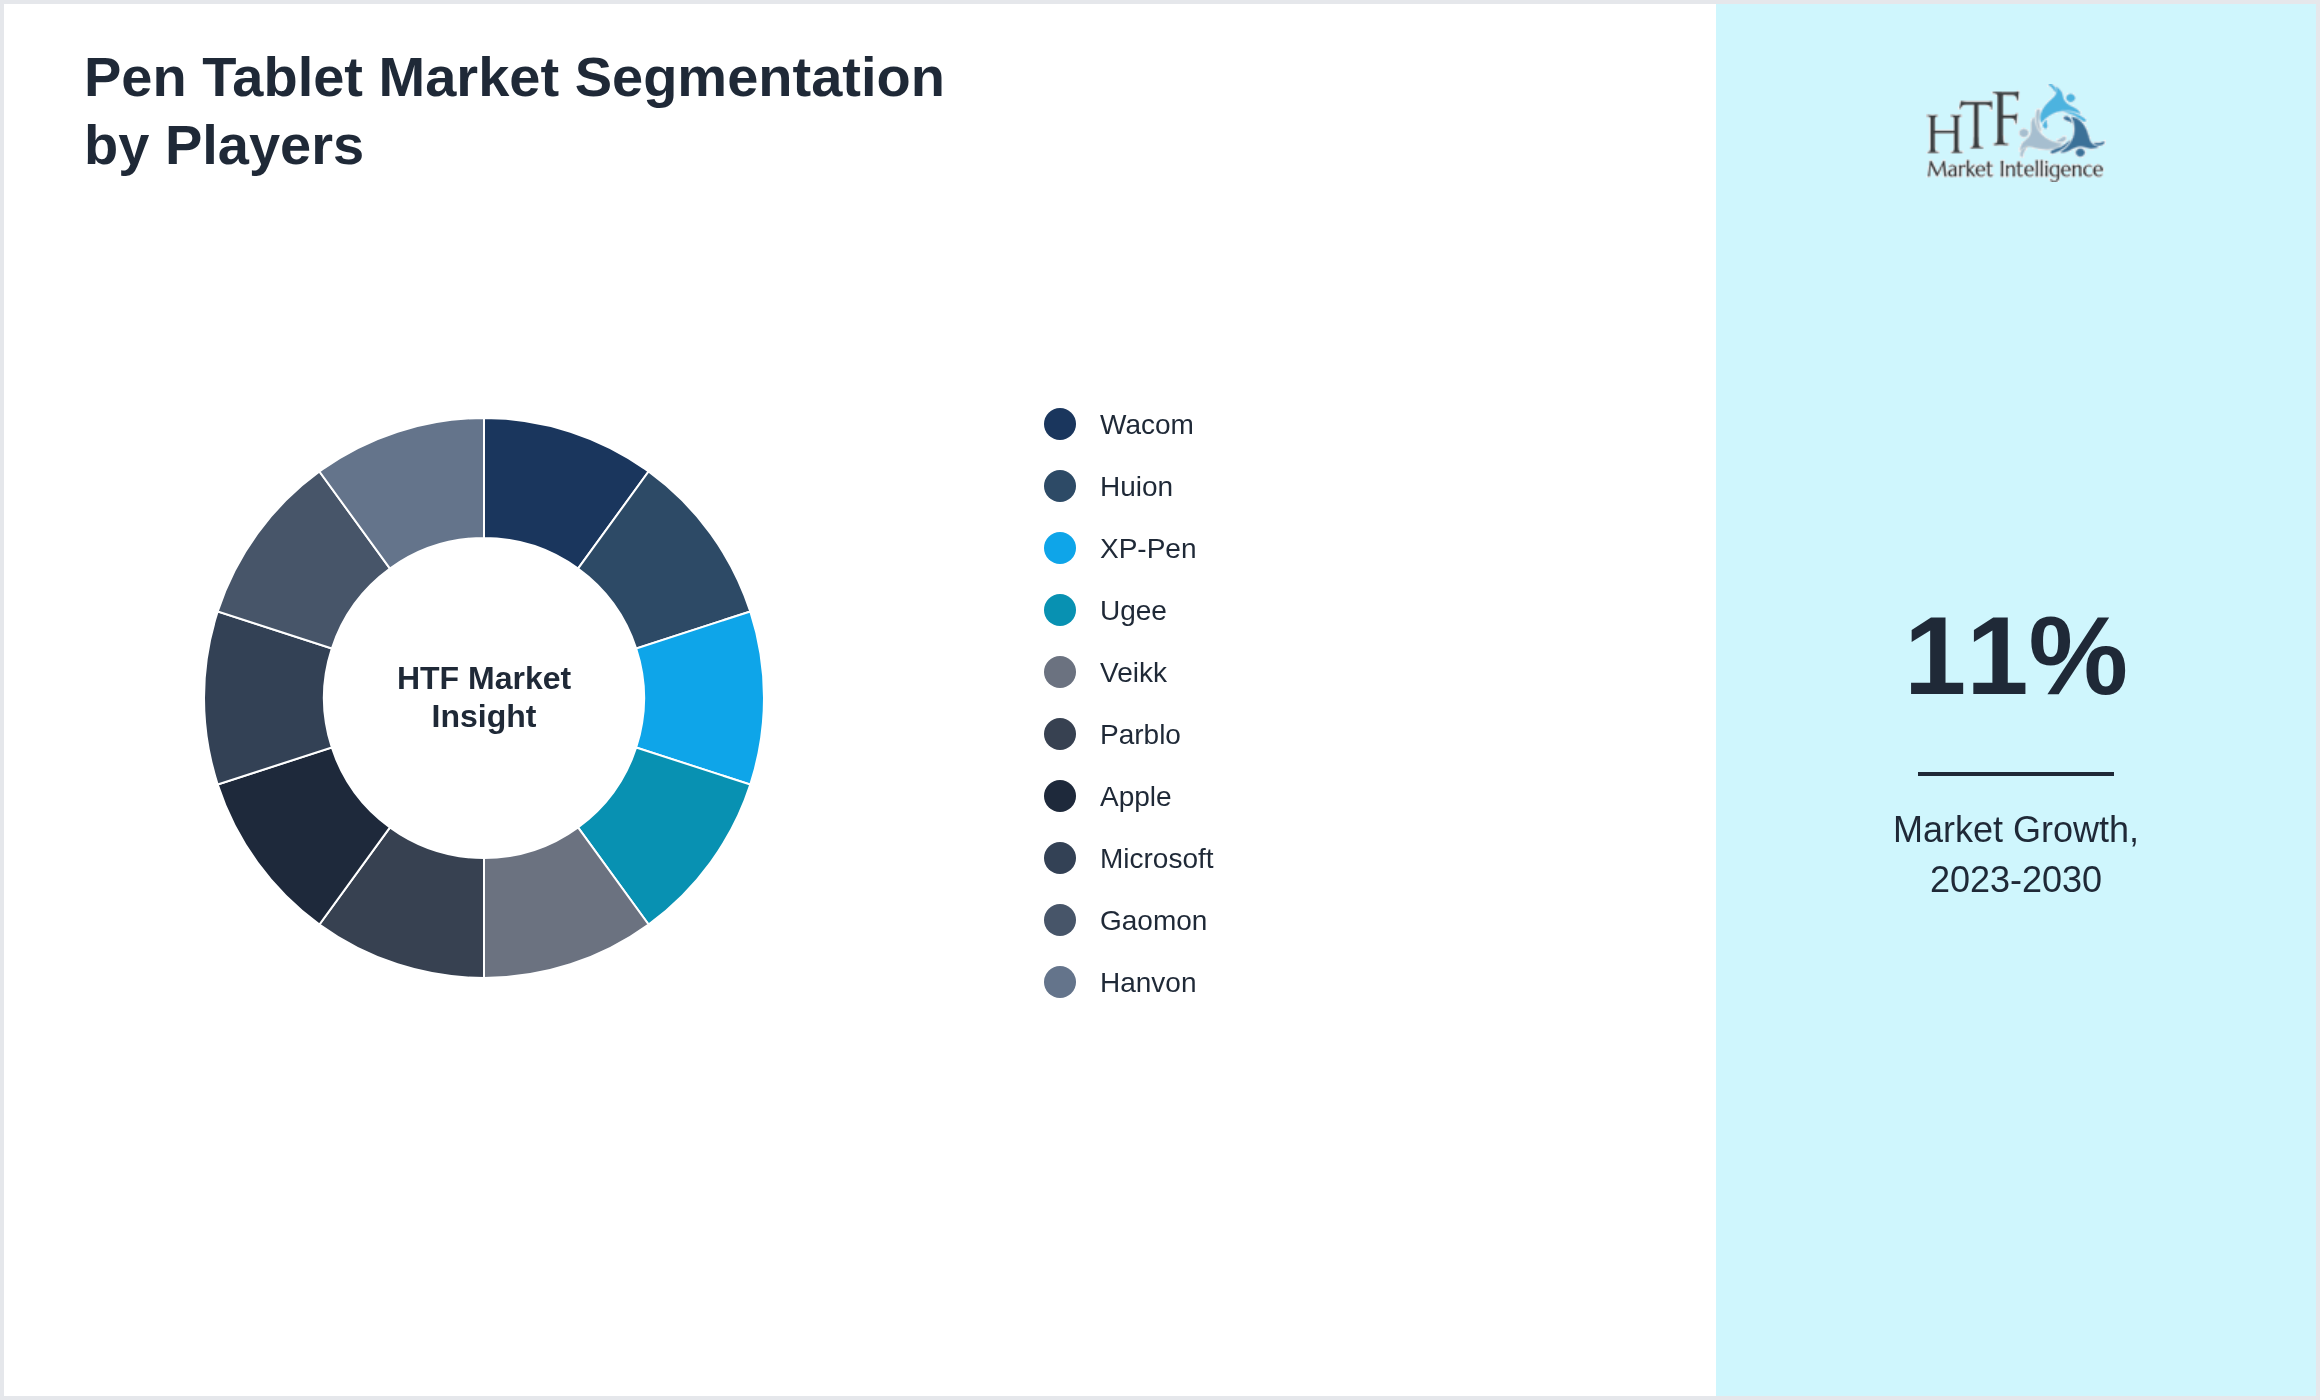
Key Players
The companies highlighted in this profile were selected based on insights from primary experts and an evaluation of their market penetration, product offerings, and geographical reach:
- • Wacom
- • Huion
- • XP-Pen
- • Ugee
- • Veikk
- • Parblo
- • Apple
- • Microsoft
- • Gaomon
- • Hanvon
Regulatory Framework
The regulatory framework for the Pen Tablet ensures product safety, fair competition, and consumer protection. It encompasses setting standards for product quality and safety, enforcing truthful advertising and labeling, and implementing environmental sustainability practices. Regulations include robust procedures for product recalls, data protection, and anti-competitive practices, while also overseeing import/export controls and intellectual property rights. Regulatory bodies enforce these rules through inspections and penalties, and consumer education programs help individuals make informed decisions. This framework aims to protect consumers, promote fair market conditions, and encourage ethical business practices.
Competitive Insights
The key players in the Pen Tablet are intensifying their focus on research and development (R&D) activities to innovate and stay competitive. Major companies, such as Wacom, Huion, XP-Pen, Ugee, Veikk, Parblo, Apple, Microsoft, Gaomon, Hanvon, are heavily investing in R&D to develop new products and improve existing ones. This strategic emphasis on innovation is driving significant advancements in product formulation and the introduction of sustainable and eco-friendly products.
In addition to R&D and acquisitions, there is a notable shift towards green investments among key players in the consumer goods industry. Companies are increasingly committing resources to sustainable practices and the development of environmentally friendly products. This green investment is in response to growing consumer demand for sustainable solutions and stringent environmental regulations. By prioritizing sustainability, these companies are not only contributing to environmental protection but also positioning themselves as leaders in the green movement, thereby fueling market growth.
Merger Acquisition
Patent Analysis
Investment and Funding Scenario
Market Entropy
Report Infographics:
| Report Features | Details |
| Base Year | 2023 |
| Based Year Market Size 2023 | 700 Million |
| Historical Period Market Size 2019 | USD Million ZZ |
| CAGR (2023 to 2030) | 11% |
| Forecast Period | 2023 to2030 |
| Forecasted Period Market Size 2030 | 1.5 Billion |
| Scope of the Report | Graphics Tablets, Drawing Tablets, Digital Art Tablets, Stylus Pens, Tablet Monitors, Design Industry, Architecture, Engineering, Animation, Digital Art |
| Regions Covered | North America, LATAM, West Europe, Central & Eastern Europe, Northern Europe, Southern Europe, East Asia, Southeast Asia, South Asia, Central Asia, Oceania, MEA |
| Year-on-Year Growth | N/A |
| Companies Covered | Wacom, Huion, XP-Pen, Ugee, Veikk, Parblo, Apple, Microsoft, Gaomon, Hanvon |
| Customization Scope | 15% Free Customization (For EG) |
| Delivery Format | PDF and Excel through Email
Want to Buy Specific Sections of This Report?
|
Research Methodology
The research methodology for the consumer goods industry involves several key steps to ensure comprehensive and actionable insights. First, the research objectives are clearly defined, focusing on aspects like consumer behavior, market opportunities, competitive dynamics, or regulatory impacts. A thorough literature review follows, drawing from academic journals, industry reports, government publications, and market analyses to establish a knowledge base and identify research gaps. Data collection encompasses both primary methods, such as surveys, interviews, and focus groups with consumers and industry experts, and secondary methods, including analysis of market reports, government data, and industry publications. Quantitative data is analyzed using statistical tools to identify patterns and market segments, while qualitative data from interviews and focus groups is examined to extract key themes and insights.
The market is then segmented based on demographics, psychographics, geography, and purchasing behavior, and competitive analysis is conducted to evaluate key players' strategies and strengths. Trend analysis identifies current and emerging industry trends. Findings are compiled into a detailed report with data visualizations and strategic recommendations. The research is validated and refined through cross-checking and expert feedback, and a framework for continuous monitoring is established to keep the research current and relevant.
Multidisciplinary researcher with 10+ years of experience uncovering insights across diverse domains focused on uncovering insights that drive informed decisions.