
Clean Energy Technology Market Research Report
Global Clean Energy Technology Market - Global Outlook 2024-2030
Global Clean Energy Technology Market is segmented by Application (Businesses, Governments, Consumers), Type (Renewable energy, Sustainability, Environmental technology), and Geography (North America, LATAM, West Europe, Central & Eastern Europe, Northern Europe, Southern Europe, East Asia, Southeast Asia, South Asia, Central Asia, Oceania, MEA)
Pricing
Key Aspects of the Market Report
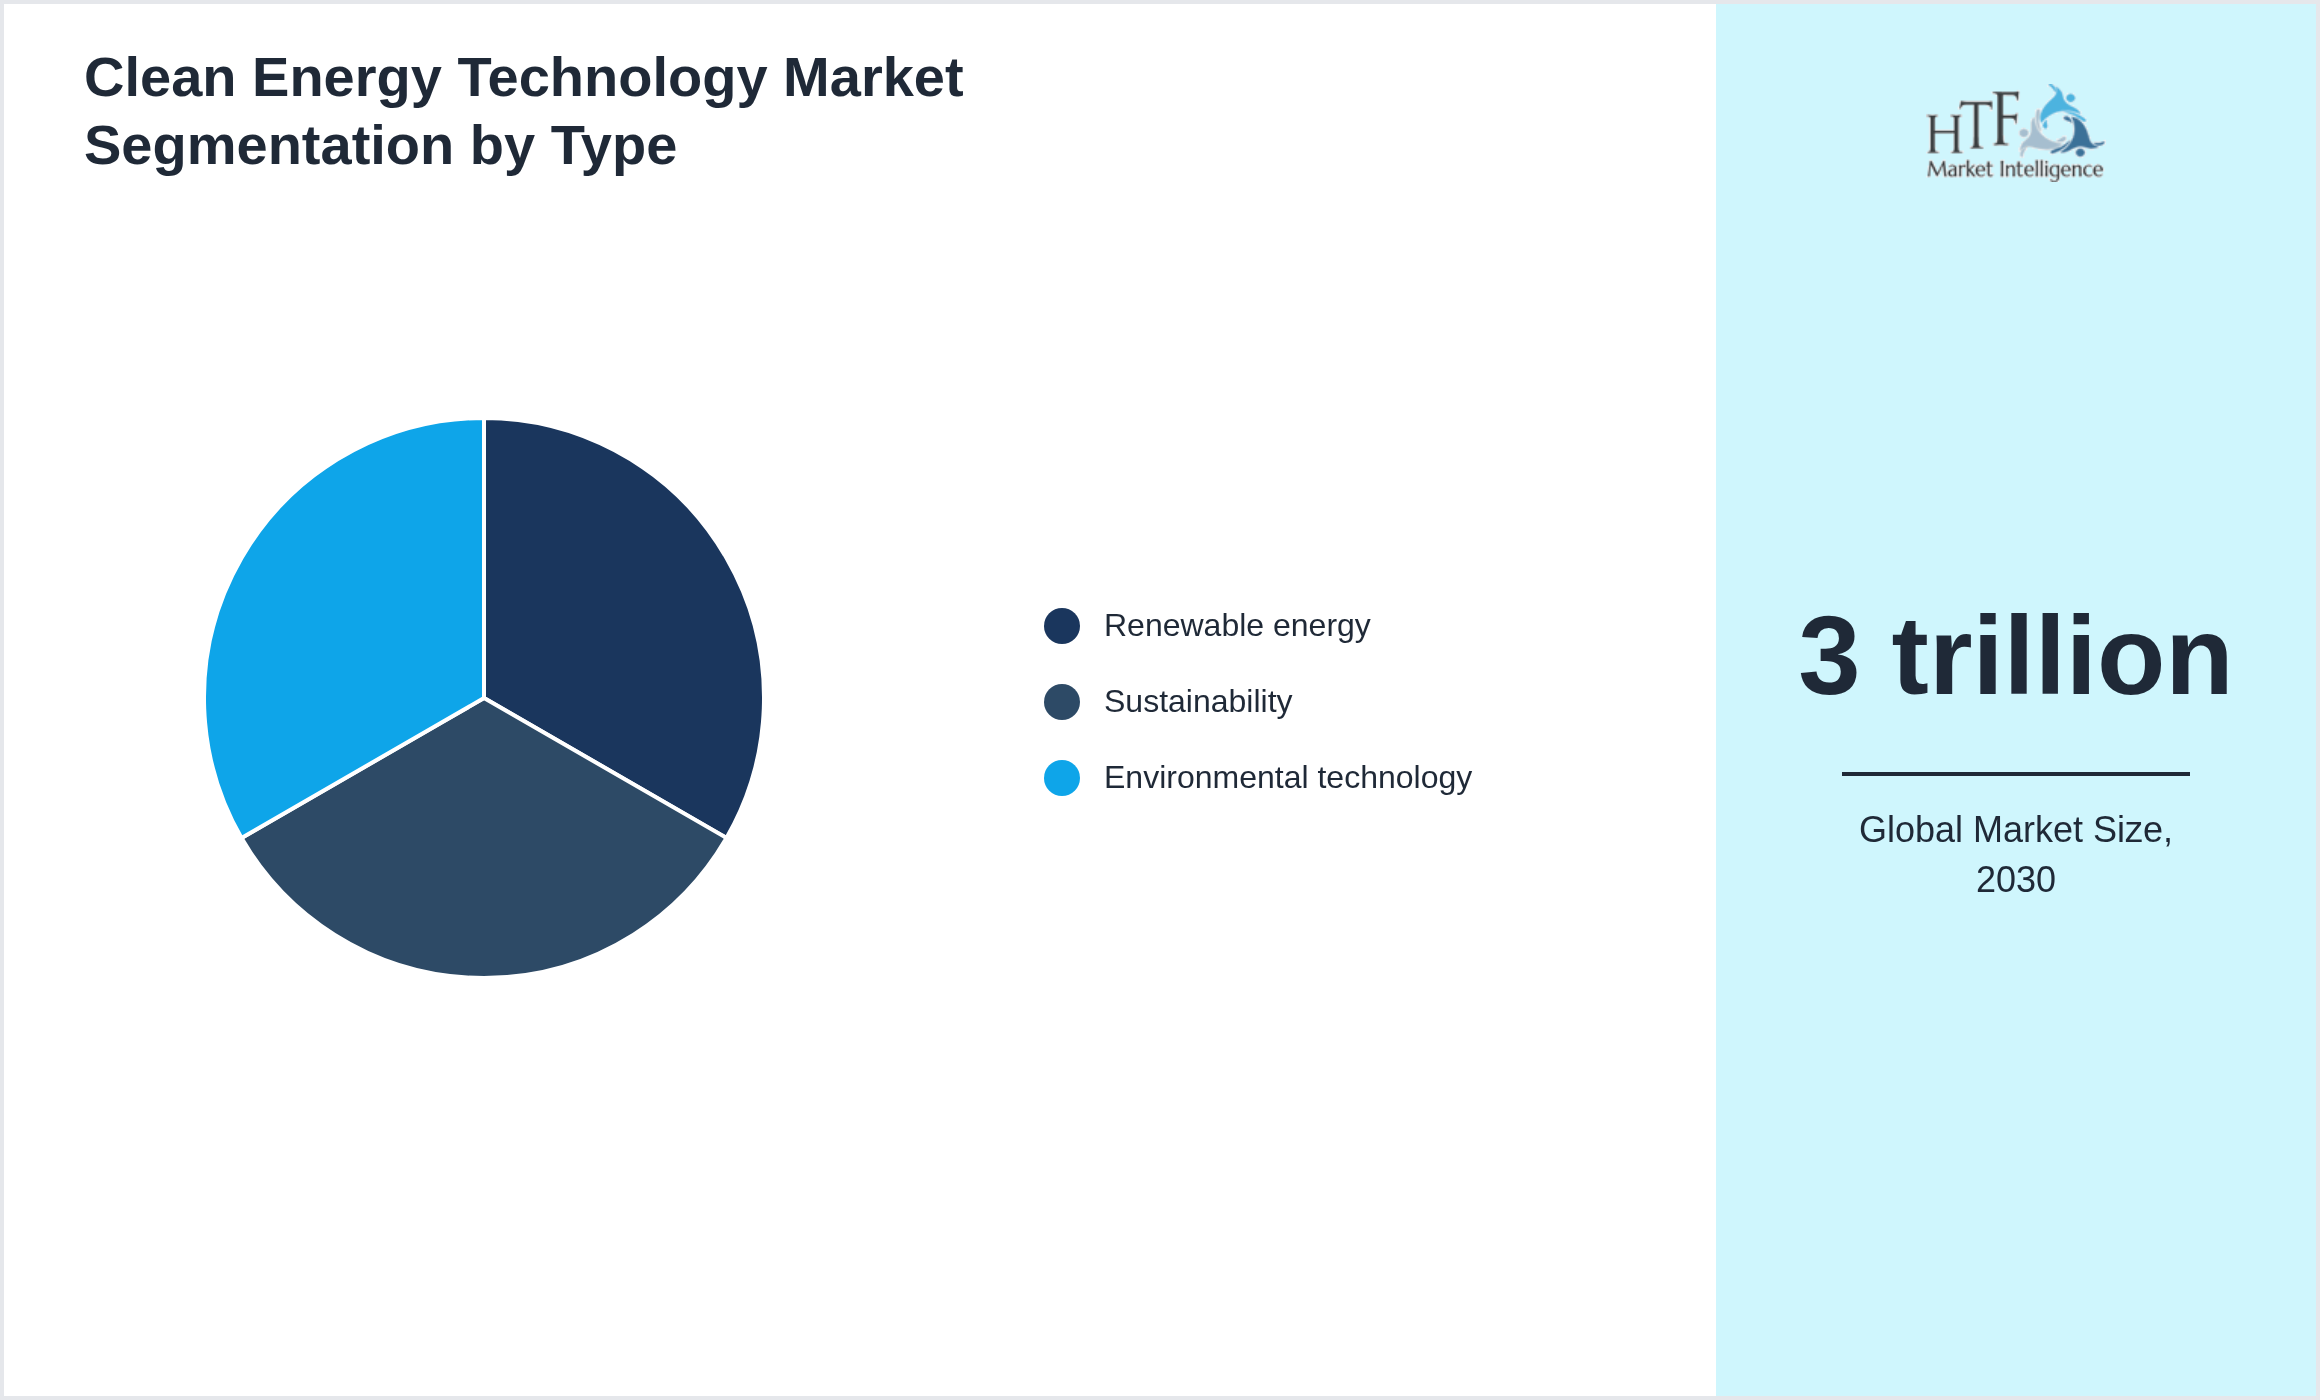
The Clean Energy Technology is growing at 10.50% and is expected to reach 3 trillion by 2030. Below are some of the dynamics shaping the Clean Energy Technology.
The Clean Energy Technology Market focuses on the development and adoption of technologies that generate energy from renewable sources and reduce environmental impact. These technologies include solar, wind, hydro, geothermal, and biomass energy, as well as energy storage systems and smart grids. The market is growing due to the increasing global demand for sustainable energy solutions, government policies promoting green energy, and the need to reduce greenhouse gas emissions. Clean energy technologies are seen as key to achieving energy security, mitigating climate change, and transitioning to low-carbon economies. As innovations in energy storage, grid integration, and renewable energy efficiency continue to advance, the clean energy technology market is expected to expand. Governments, businesses, and consumers are all contributing to the growth of this market as they seek to embrace more sustainable and cost-effective energy solutions.
A Clean Energy Technology market research report effectively communicates vital insights through several key aspects. It begins with an executive summary that concisely outlines the findings, conclusions, and actionable recommendations, allowing stakeholders to quickly grasp essential information. Clearly stating the research objectives ensures the purpose and specific questions being addressed are understood. The methodology section describes the research methods employed, such as surveys or focus groups, and provides a rationale for their selection to establish credibility. A market overview presents the industry landscape, including market size, growth trends, and key drivers.
Additionally, the segmentation analysis examines distinct market segments to identify varied customer needs. The competitive analysis offers insights into major competitors, highlighting their strengths and weaknesses. Finally, the report concludes with key findings and insights, followed by conclusions and recommendations that provide actionable strategies to guide future business decisions.

Clean Energy Technology Market Dynamics
Influencing Trend:
- • Renewable energy
- • Energy efficiency
- • Green building
- • Waste management
- • Emerging markets
- • New technologies
- • Sustainability
- • Government policies
- • Competition
- • Cost
- • Implementation
- • Public acceptance
- • Emerging markets
- • New technologies
- • Sustainability
- • Government policies
Limitation & Assumptions
Limitations and assumptions in a market research report are critical for framing the context and reliability of the findings. Limitations refer to potential weaknesses or constraints that may impact the research outcomes. These can include a limited sample size, which may not represent the broader population, or reliance on self-reported data, which can introduce bias. Other limitations may involve geographical constraints, where findings may not be applicable outside the studied regions, or temporal factors, such as rapidly changing market conditions, that can render results less relevant over time.
Assumptions are foundational beliefs taken for granted in the research process. For instance, it may be assumed that respondents provided honest and accurate information or that market conditions remained stable during the research period. Acknowledging these limitations and assumptions helps stakeholders critically evaluate the validity of the report's conclusions and guides strategic decisions based on the inherent uncertainties of the research.
For the complete companies list, please ask for sample pages.
Questions Answered in Our Report
A market research report typically addresses several key questions that guide decision-making and strategic planning. First, it answers what are the current market trends and how are they influencing consumer behavior Understanding trends helps identify growth opportunities and potential threats. Next, the report explores who are the target customers by segmenting the market based on demographics, preferences, and purchasing behavior, allowing for tailored marketing strategies.
The report also investigates who are the key competitors in the market, detailing their strengths, weaknesses, and market positioning. Another critical question is what are the market opportunities and challenges, providing insights into potential areas for expansion or risk mitigation. Additionally, the report addresses how the market is expected to evolve, including forecasts for growth and potential shifts in consumer preferences. Finally, it concludes with what actionable recommendations can be implemented to capitalize on insights and improve overall business performance.
Research Methodology & Data Triangulation
Data triangulation is a robust research method that enhances the credibility and validity of findings by combining multiple data sources, methodologies, or perspectives. This approach involves three primary types: data source triangulation, where information is gathered from different sources such as surveys, interviews, and secondary data; methodological triangulation, which integrates various research methods, such as qualitative and quantitative techniques, to enrich the analysis; and investigator triangulation, where multiple researchers collaborate to interpret data, minimizing individual bias.
By employing data triangulation, businesses can gain a more comprehensive understanding of market dynamics and consumer behavior. This method helps validate findings by cross-referencing information, ensuring that conclusions are not based on a single data point. Consequently, triangulation enhances decision-making processes, as organizations can rely on more accurate and reliable insights. Ultimately, this approach fosters confidence in strategic planning and contributes to more effective risk management and resource allocation.
Competitive Landscape
The competitive landscape of the market provides a comprehensive analysis of the key players and their market positioning. It identifies the leading companies, including both established firms and emerging competitors, outlining their strengths such as innovation, strong brand presence, and extensive customer base, as well as weaknesses like limited product range or geographic reach. This section also delves into how these competitors position themselves in the market, whether they target premium, mid-tier, or budget segments, and how they differentiate from others through pricing, product innovation, or customer service.
Additionally, it highlights significant strategic moves, such as mergers, acquisitions, or product launches, that have impacted their competitive standing. The role of technology and innovation is another key factor, with companies investing in research and development to stay ahead. By understanding this competitive landscape, businesses can better identify market opportunities, anticipate competitor strategies, and adjust their approaches to gain a stronger foothold.
Segmentation by Type
- • Renewable energy
- • Sustainability
- • Environmental technology
Segmentation by Application
- • Businesses
- • Governments
- • Consumers
![Clean Energy Technology Market trend by end use applications [Businesses, Governments, Consumers]](https://htf-insight.s3.us-east-1.amazonaws.com/generated-charts/chart-pie-and-donut-chart-application-3545155-na-1759872162330-1759872167332-672c81551192eaef.png)
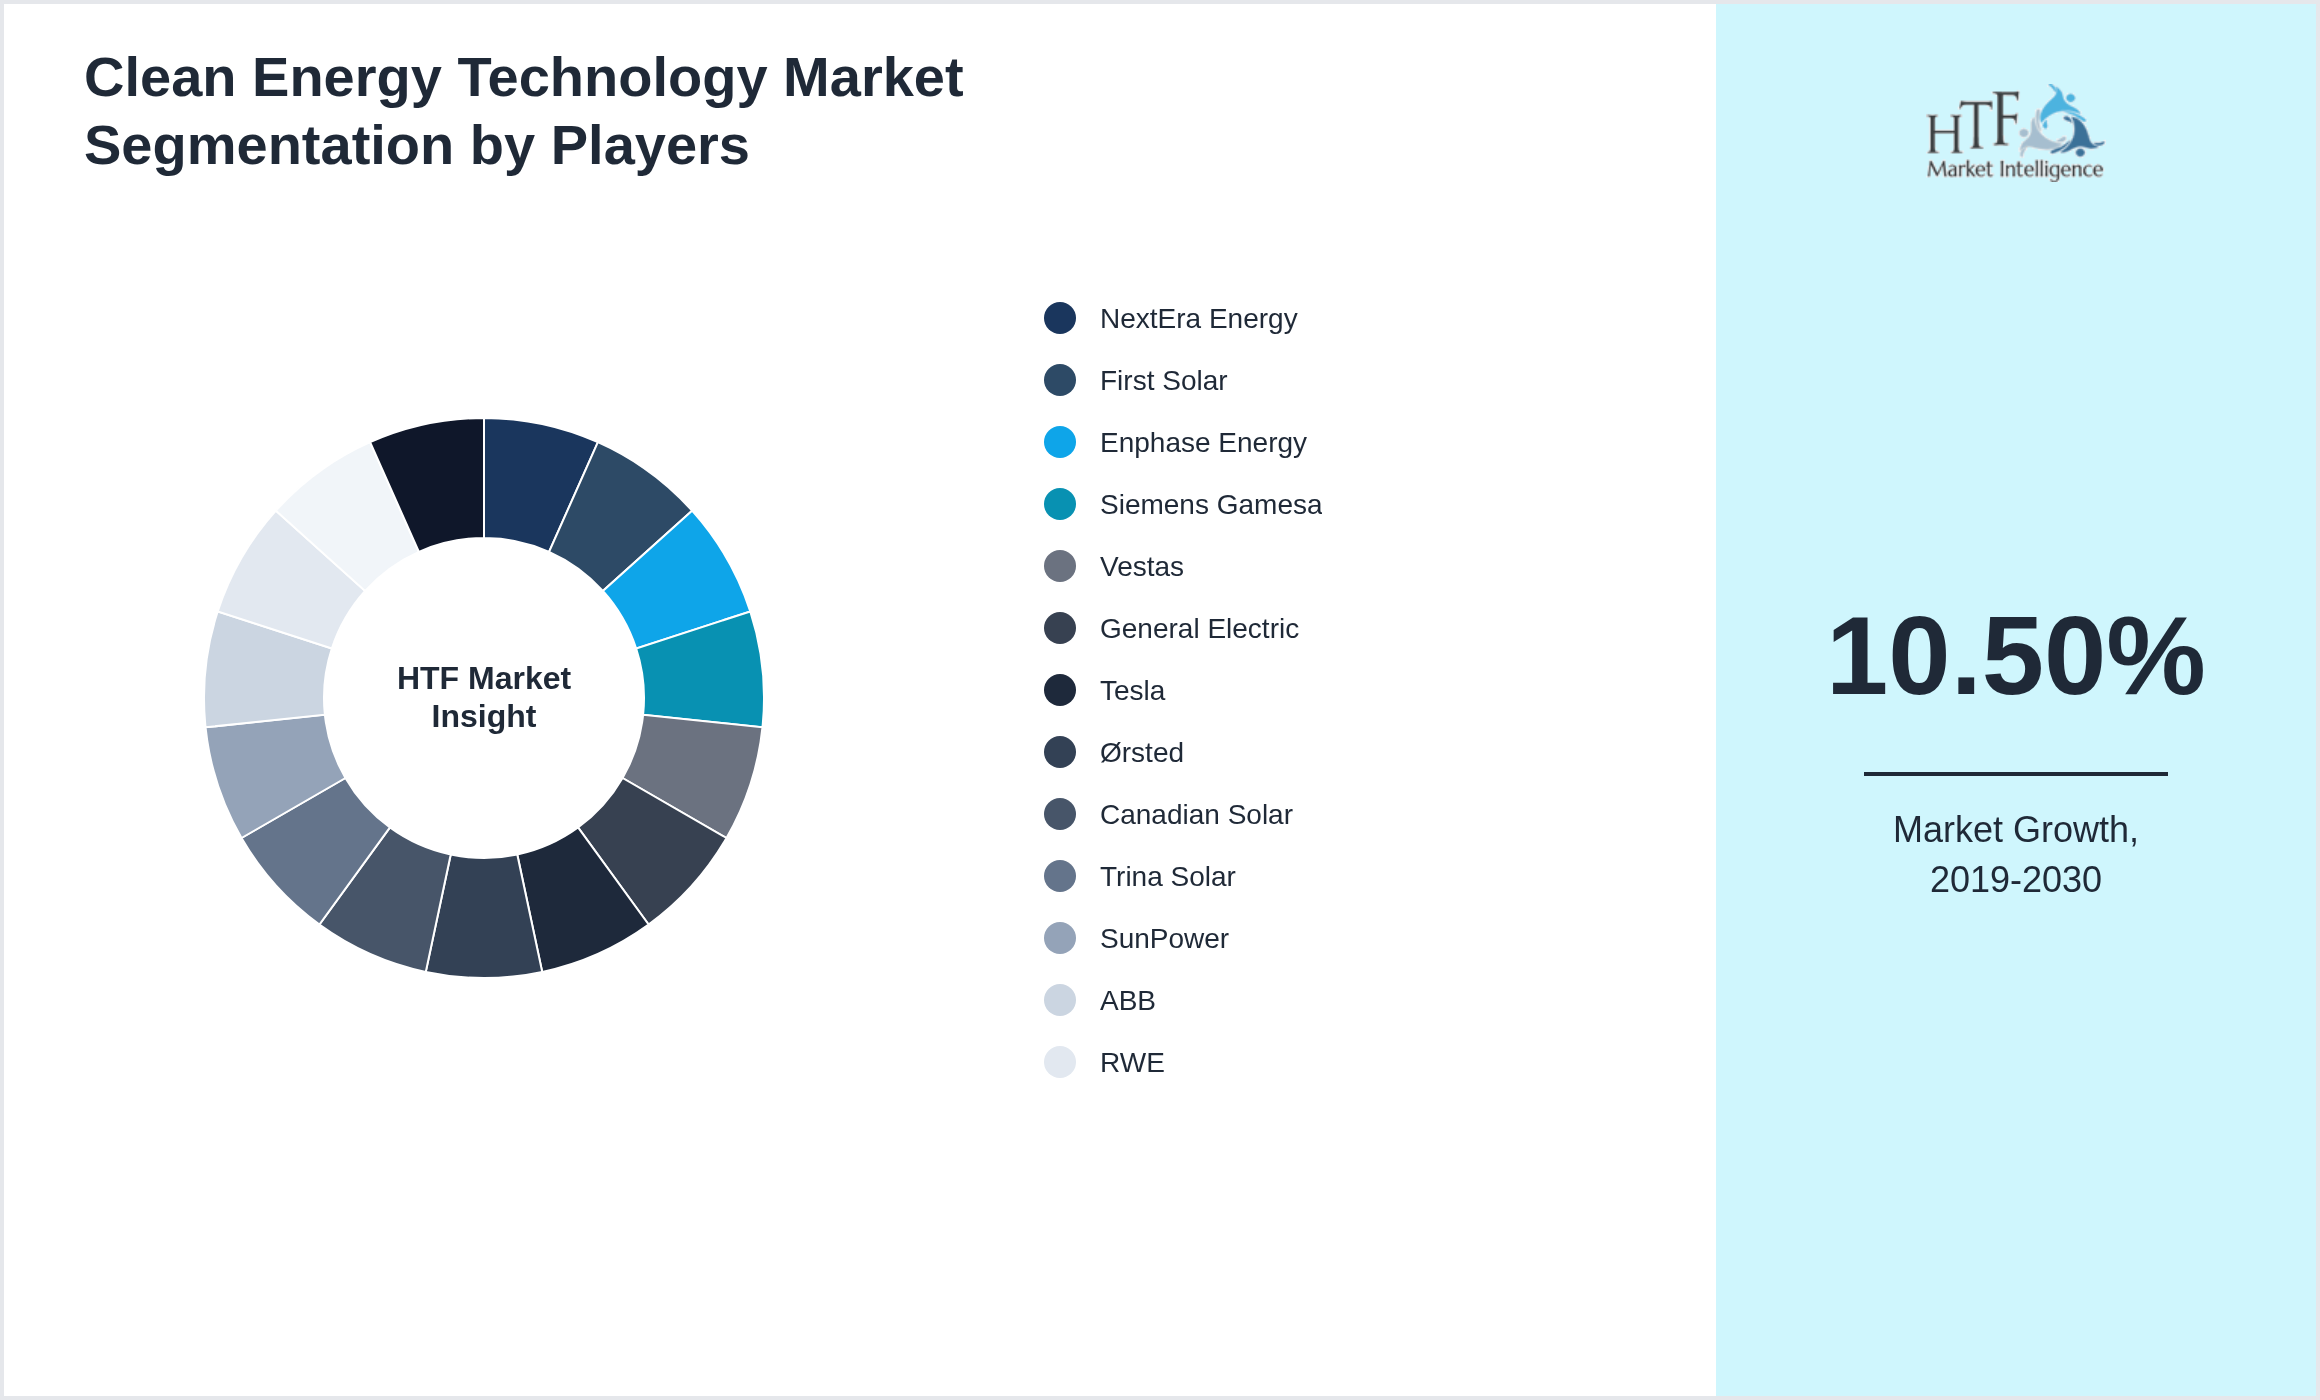
Key Players
The companies highlighted in this profile were selected based on insights from primary experts and an evaluation of their market penetration, product offerings, and geographical reach:
{PLAYERS_LIST}
Regional Outlook
The North America is the fastest-growing region due to its rapidly increasing population and expanding economic activities across various industries. This growth is further fueled by rising urbanization, improving infrastructure, and government initiatives aimed at fostering industrial development. Additionally, the region's young and dynamic workforce, along with an increase in consumer spending, contributes significantly to its accelerated growth rate. The North America is the dominating region and is going to maintain its dominance during the forecasted period.
The North American region, particularly the United States, stands out as a key area for the healthcare industry due to its advanced infrastructure, high healthcare expenditure, and significant research and development activities. The U.S. remains a leader in healthcare innovation driven by substantial investments in biotechnology, pharmaceuticals, and medical devices.
- North America
- LATAM
- West Europe
- Central & Eastern Europe
- Northern Europe
- Southern Europe
- East Asia
- Southeast Asia
- South Asia
- Central Asia
- Oceania
- MEA
Among the major investors, Johnson & Johnson is a prominent player. The company consistently allocates significant resources to expand its research capabilities, develop new medical technologies, and enhance its pharmaceutical portfolio. Johnson & Johnson's investments in R&D, coupled with strategic acquisitions and partnerships, reinforce its position as a major contributor to advancements in healthcare. This focus on innovation and market expansion underscores the critical importance of the North American region in the global healthcare landscape.
tag
Market Estimation Process
Report Details
| Report Features | Details |
| Base Year | 2019 |
| Based Year Market Size (2019) | 1.5 trillion |
| Historical Period | 2024 to 2019 |
| CAGR (2019 to 2030) | 10.50% |
| Forecast Period | 2025 to 2030 |
| Forecasted Period Market Size (2030) | 3 trillion |
| Scope of the Report | Renewable energy, Sustainability, Environmental technology, Businesses, Governments, Consumers |
| Regions Covered | North America, LATAM, West Europe, Central & Eastern Europe, Northern Europe, Southern Europe, East Asia, Southeast Asia, South Asia, Central Asia, Oceania, MEA |
| Companies Covered | NextEra Energy, First Solar, Enphase Energy, Siemens Gamesa, Vestas, General Electric, Tesla, Ørsted, Canadian Solar, Trina Solar, SunPower, ABB, RWE, EDP Renewables, Engie |
| Customization Scope | 15% Free Customization |
| Delivery Format | PDF and Excel through Email |
Clean Energy Technology - Table of Contents
Chapter 1: Market Preface
Chapter 2: Strategic Overview
Chapter 3: Global Clean Energy Technology Market Business Environment & Changing Dynamics
Chapter 4: Global Clean Energy Technology Industry Factors Assessment
Chapter 5: Clean Energy Technology : Competition Benchmarking & Performance Evaluation
Chapter 6: Global Clean Energy Technology Market: Company Profiles
Chapter 7: Global Clean Energy Technology by Type & Application (2024-2030)
Chapter 8: North America Clean Energy Technology Market Breakdown by Country, Type & Application
Chapter 9: Europe Clean Energy Technology Market Breakdown by Country, Type & Application
Chapter 10: Asia Pacific Clean Energy Technology Market Breakdown by Country, Type & Application
Chapter 11: Latin America Clean Energy Technology Market Breakdown by Country, Type & Application
Chapter 12: Middle East & Africa Clean Energy Technology Market Breakdown by Country, Type & Application
Chapter 13: Research Finding and Conclusion
Frequently Asked Questions (FAQ):
The Compact Track Loaders market is projected to grow at a CAGR of 6.8% from 2025 to 2030, driven by increasing demand in construction and agricultural sectors.
North America currently leads the market with approximately 45% market share, followed by Europe at 28% and Asia-Pacific at 22%. The remaining regions account for 5% of the global market.
Key growth drivers include increasing construction activities, rising demand for versatile equipment in agriculture, technological advancements in track loader design, and growing preference for compact equipment in urban construction projects.