
Soy Oil & Palm Oil Market Research Report
Soy Oil & Palm Oil Market - Global Size & Outlook 2024-2030
Global Soy Oil & Palm Oil Market is segmented by Application (Food Processing, Cooking, Biodiesel Production, Cosmetics, Industrial Applications), Type (Refined Soy Oil, Crude Soy Oil, Palm Kernel Oil, Crude Palm Oil, RBD Palm Oil), and Geography (North America, LATAM, West Europe, Central & Eastern Europe, Northern Europe, Southern Europe, East Asia, Southeast Asia, South Asia, Central Asia, Oceania, MEA)
Pricing
Industry Overview
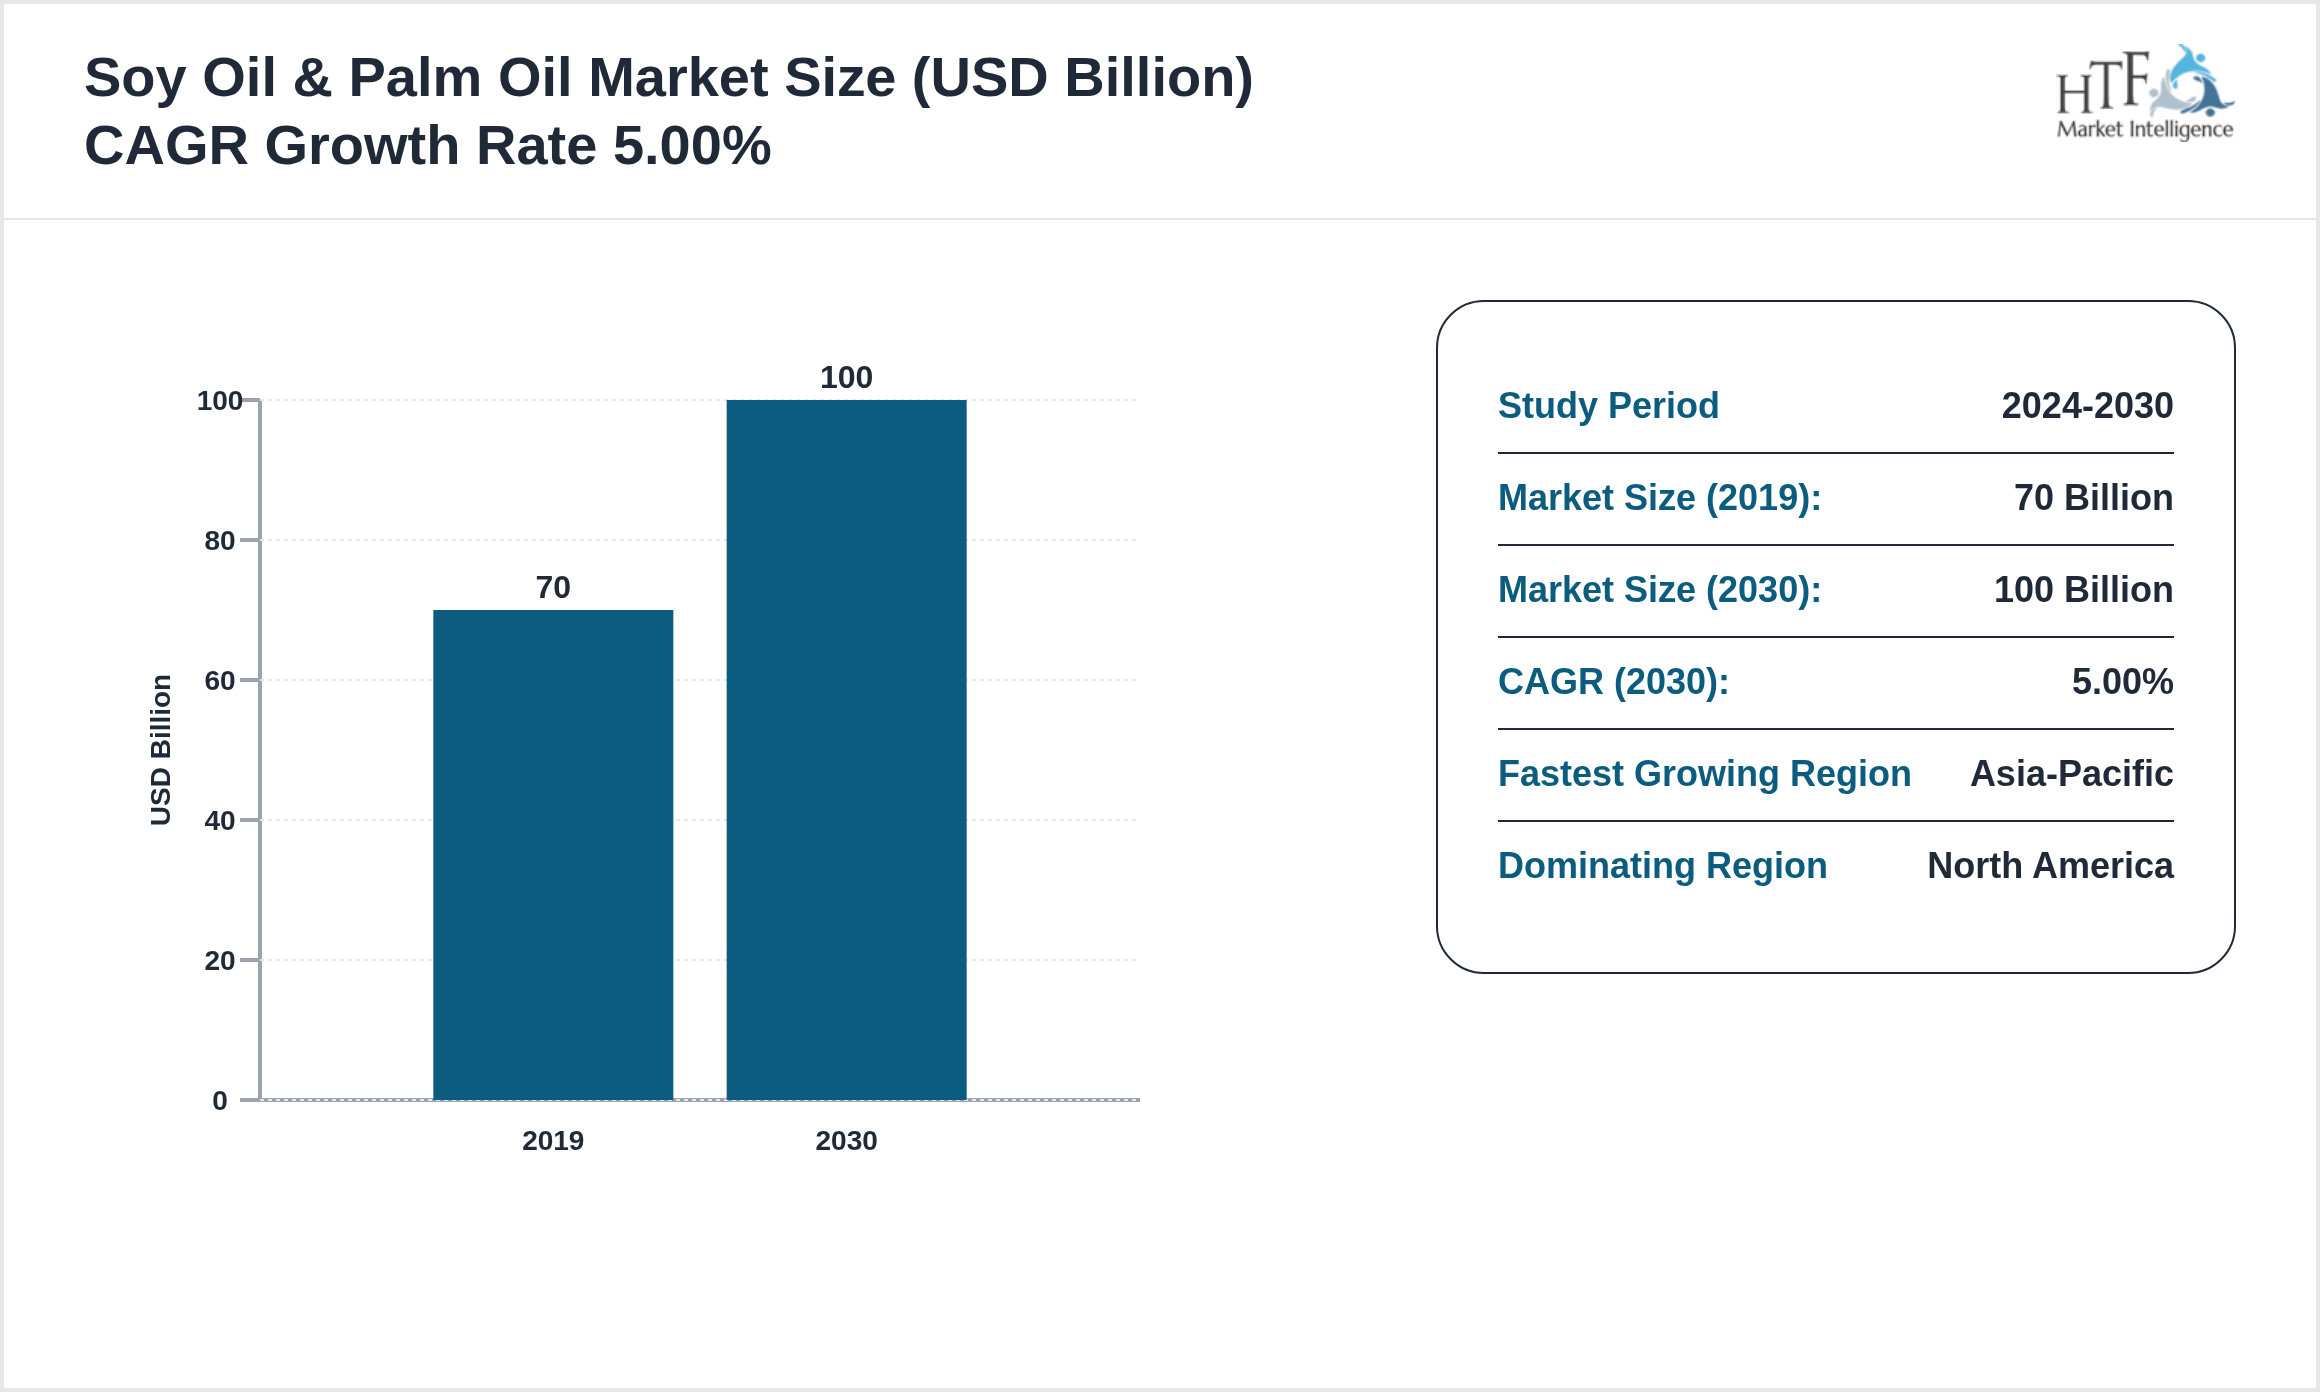
The Soy Oil & Palm Oil market is experiencing robust growth, projected to achieve a compound annual growth rate CAGR of 5.00% during the forecast period. Valued at 70 billion, the market is expected to reach 100 billion by 2030, with a year-on-year growth rate of 4.00%
The soy oil and palm oil market refers to the global production and consumption of two of the most commonly used vegetable oils. Soy oil, derived from soybeans, and palm oil, extracted from the fruit of the oil palm tree, are used in a wide range of products, including food, cosmetics, and industrial applications. The market is driven by the growing demand for vegetable oils in food processing, biofuels, and personal care products. Palm oil, due to its low cost and versatility, is the most widely consumed vegetable oil globally, though concerns about its environmental impact and deforestation have led to increased scrutiny and calls for sustainable production practices. Soy oil is also increasingly used in processed foods, cooking oils, and biodiesel production. The market is influenced by factors such as global trade policies, production yields, and consumer preferences for healthier and more sustainable oils.
Data Collection Method
Data triangulation is a method used to analyze markets by gathering and comparing information from multiple sources or utilizing different research approaches to examine the same topic. This technique involves integrating data from various sources, such as surveys, interviews, and industry reports, or combining both qualitative and quantitative methods. By employing data triangulation, researchers can cross-verify information, reduce biases, and achieve a more accurate and comprehensive understanding of market dynamics.
Key Highlights of the Soy Oil & Palm Oil
• The Soy Oil & Palm Oil is growing at a CAGR of 5.00% during the forecasted period of 2019 to 2030
• Year-on-year growth for the market is 4.00%
• North America dominated the market share of 70 billion in 2019
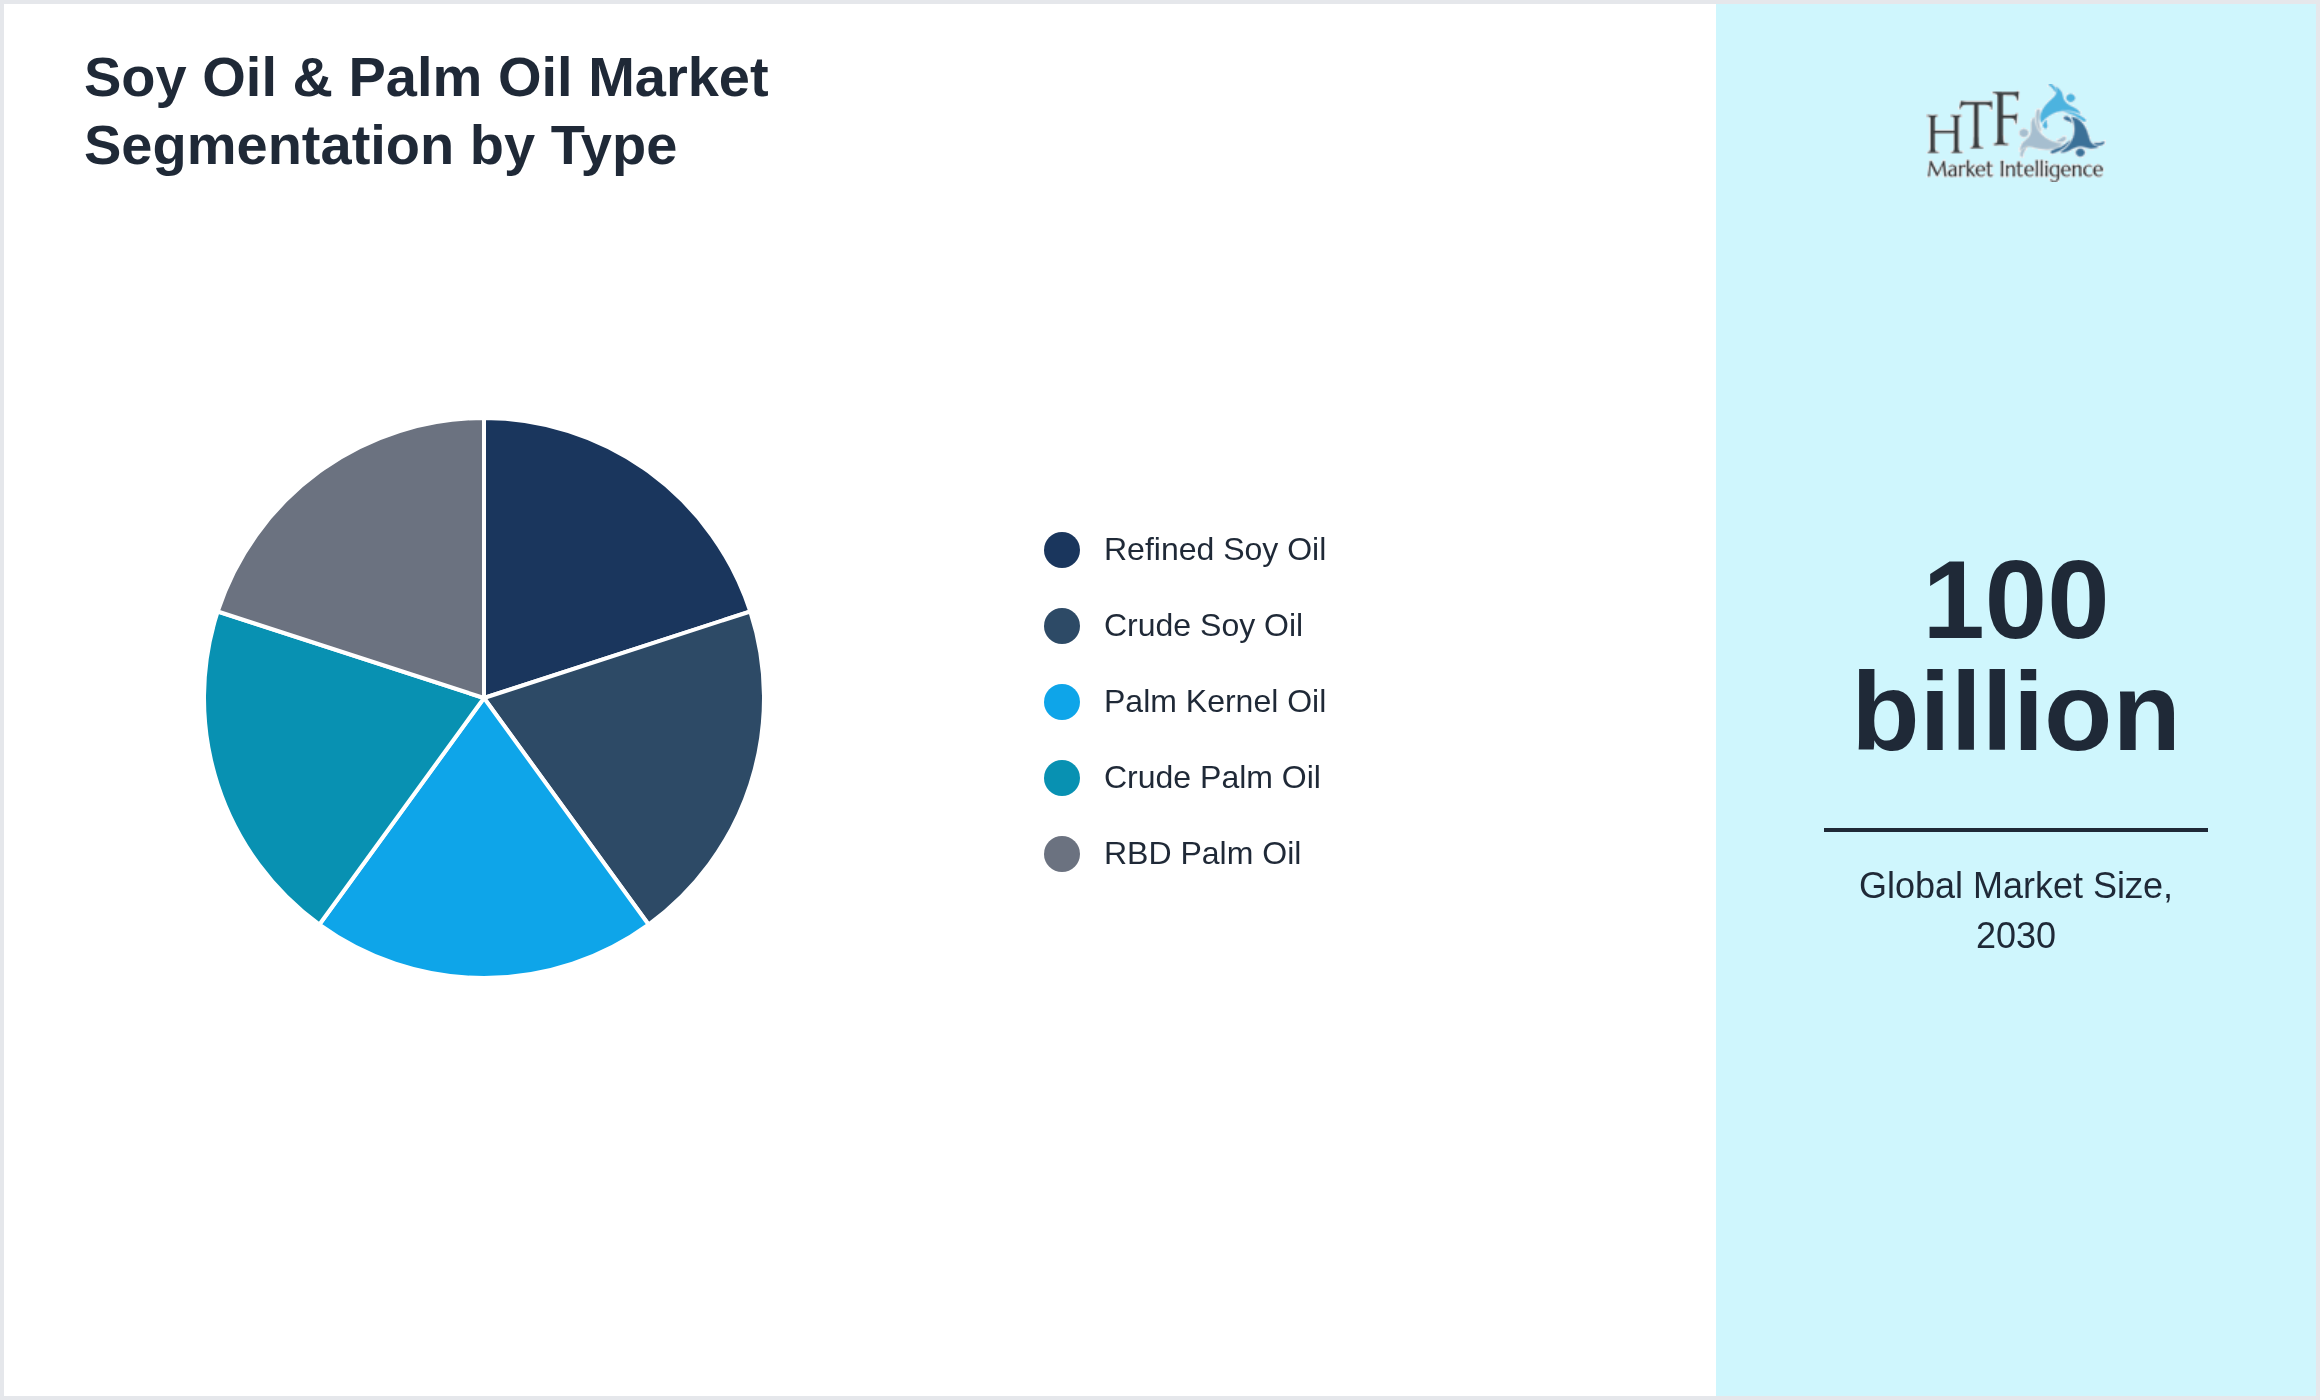
• Based on type, the market is bifurcated into Refined Soy Oil, Crude Soy Oil, Palm Kernel Oil, Crude Palm Oil, RBD Palm Oil segments, which dominated the market share during the forecasted period
Market Segmentation
Segmentation by Type
- • Refined Soy Oil
- • Crude Soy Oil
- • Palm Kernel Oil
- • Crude Palm Oil
- • RBD Palm Oil
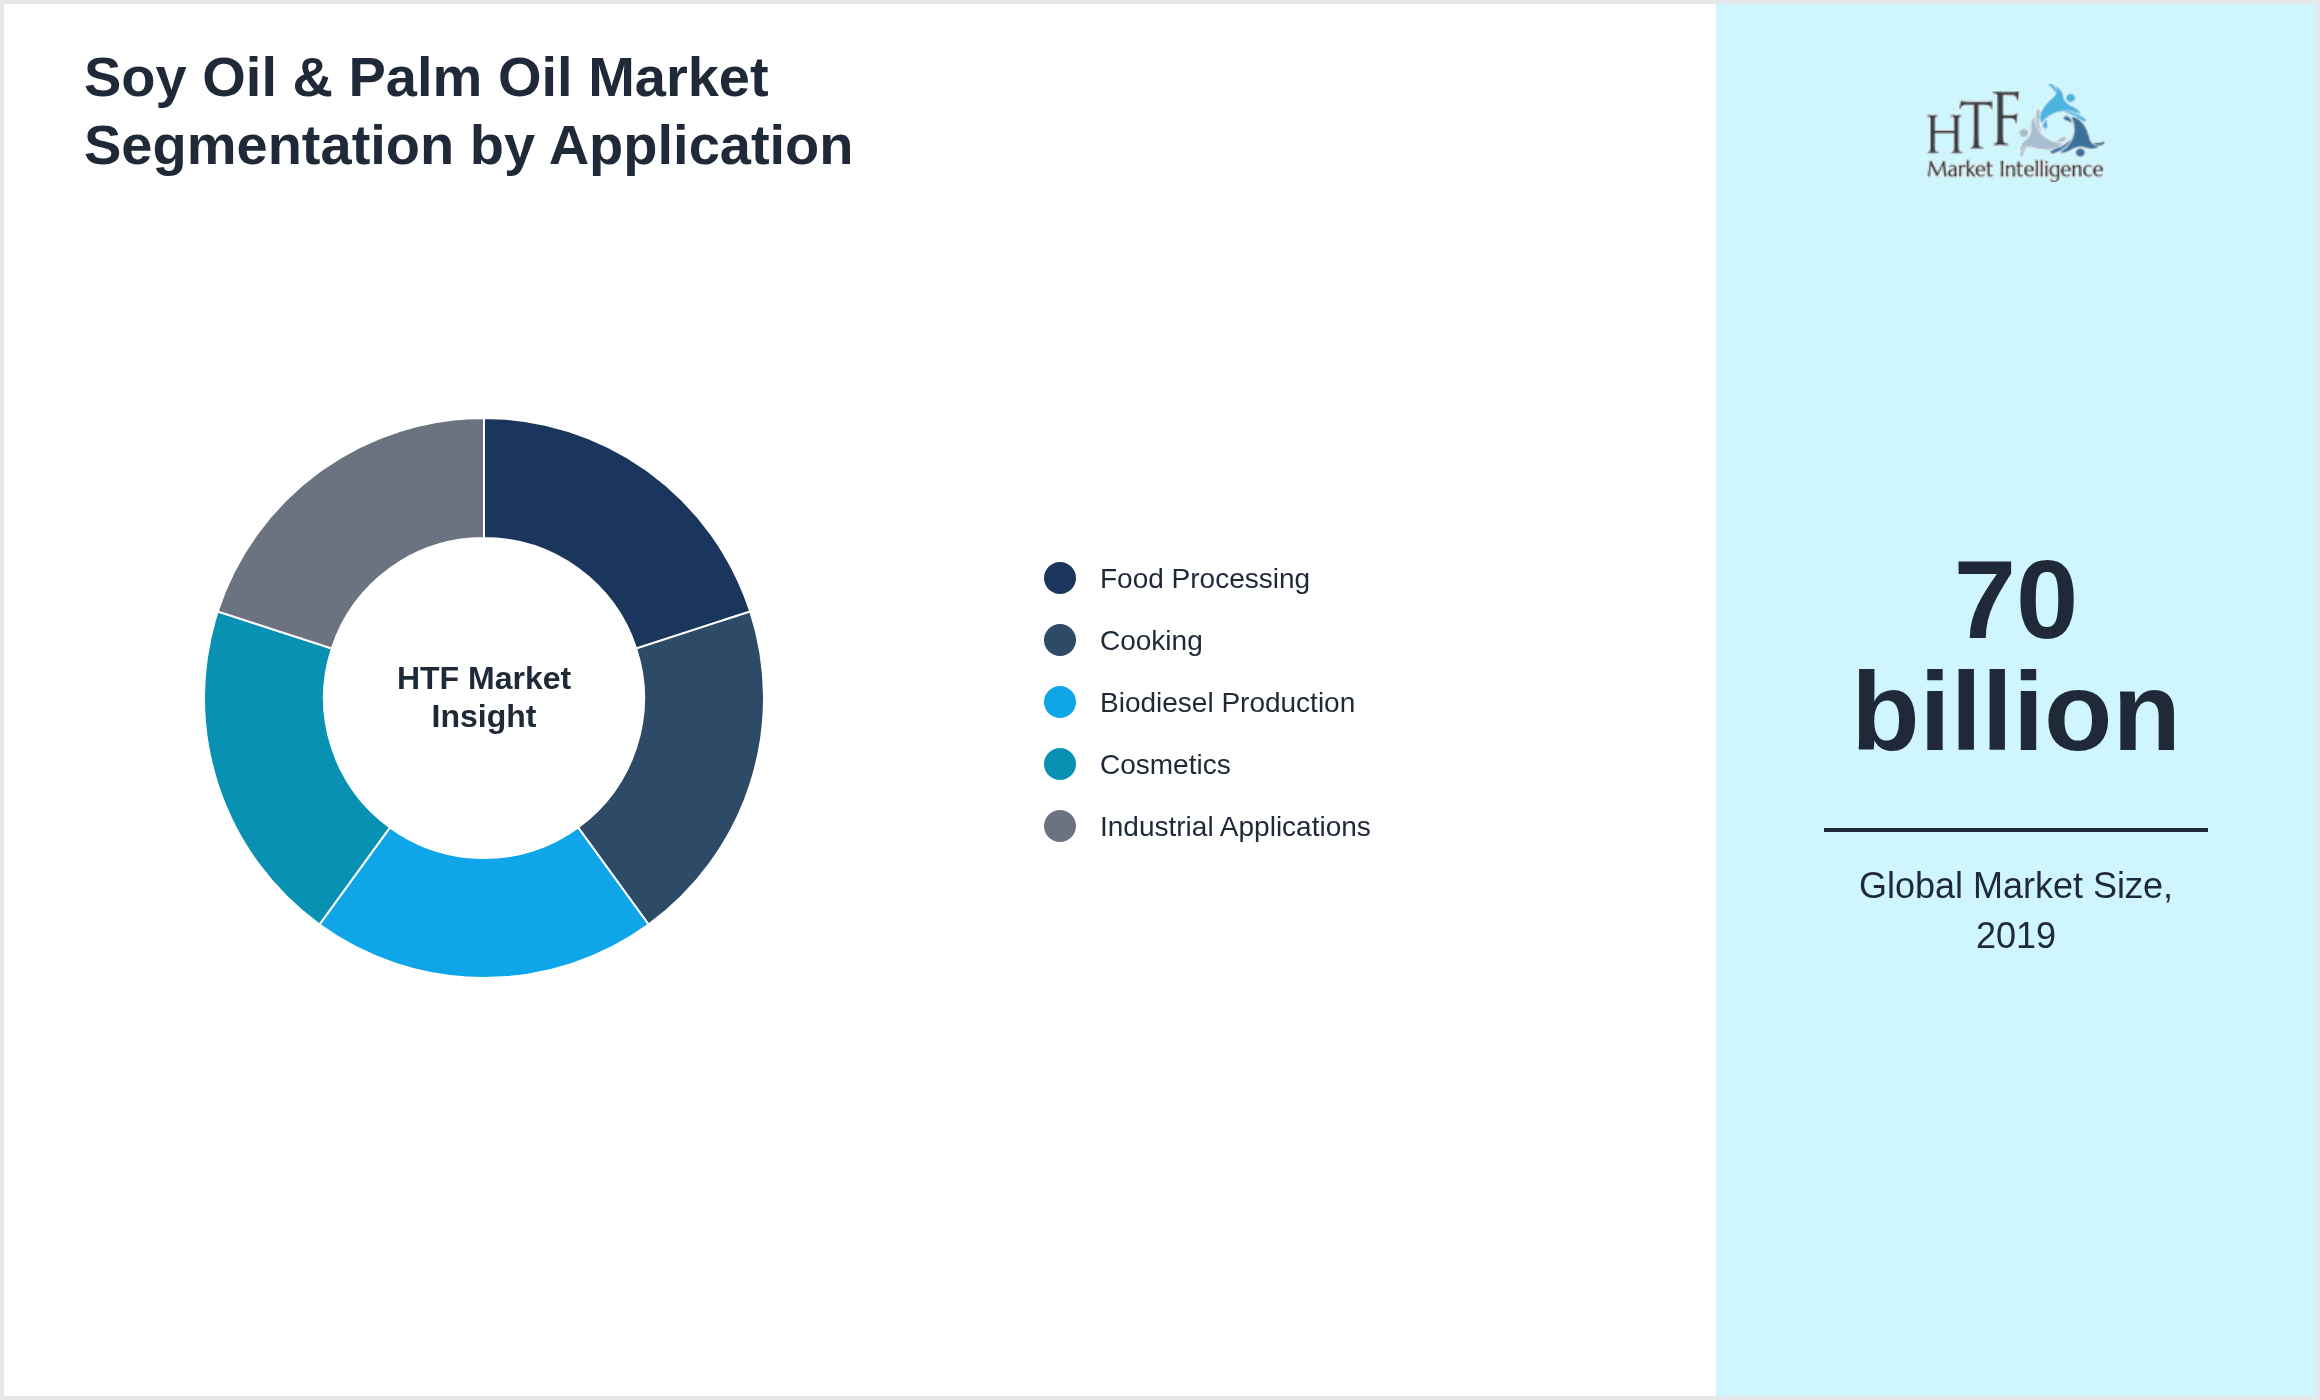
Segmentation by Application
- • Food Processing
- • Cooking
- • Biodiesel Production
- • Cosmetics
- • Industrial Applications
This report also splits the market by region
- North America
- LATAM
- West Europe
- Central & Eastern Europe
- Northern Europe
- Southern Europe
- East Asia
- Southeast Asia
- South Asia
- Central Asia
- Oceania
- MEA
Regional Insights
The Soy Oil & Palm Oil market exhibits significant regional variation, shaped by different economic conditions and consumer behaviors.
- North America: High disposable incomes and a robust e-commerce sector are driving demand for premium and convenient products.
- Europe: A fragmented market where Western Europe emphasizes luxury and organic products, while Eastern Europe experiences rapid growth.
- Asia-Pacific: Urbanization and a growing middle class drive demand for both high-tech and affordable products, positioning the region as a fast-growing market.
- Latin America: Economic fluctuations make affordability a key factor, with Brazil and Mexico leading the way in market expansion.
- Middle East & Africa: Luxury products are prominent in the Gulf States, while Sub-Saharan Africa sees gradual market growth, influenced by local preferences.
Currently, North America dominates the market due to high consumption, population growth, and sustained economic progress. Meanwhile, Asia-Pacific is experiencing the fastest growth, driven by large-scale infrastructure investments, industrial development, and rising consumer demand.
Key Players
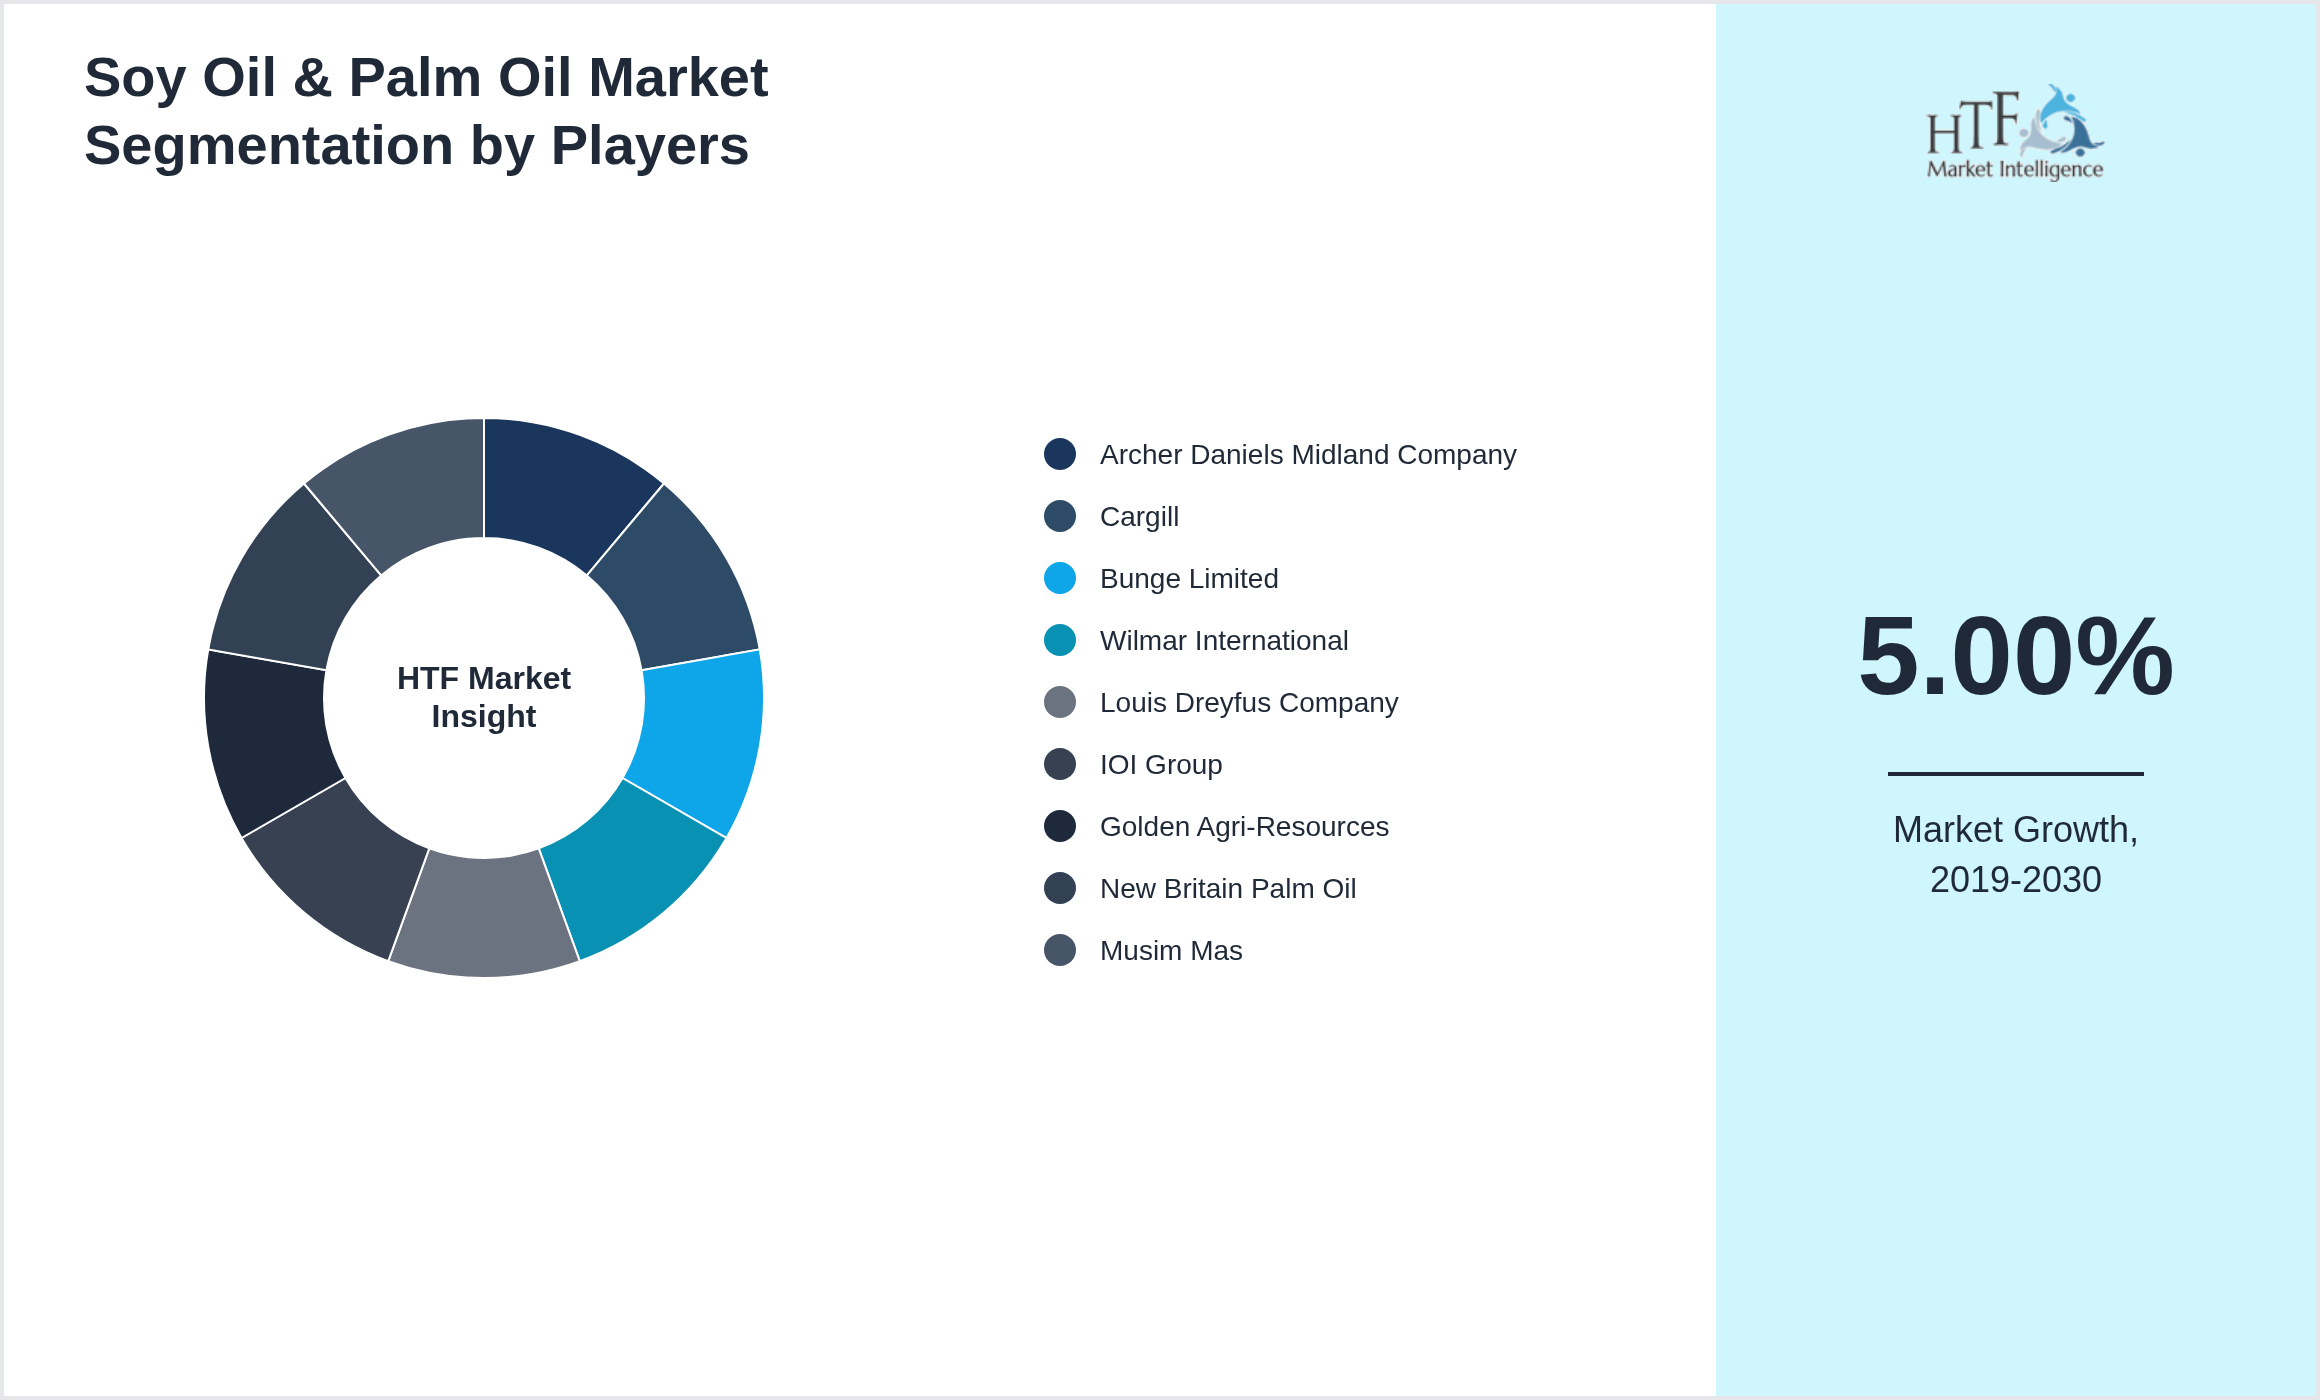
The companies highlighted in this profile were selected based on insights from primary experts and an evaluation of their market penetration, product offerings, and geographical reach:
- • Archer Daniels Midland Company
- • Cargill
- • Bunge Limited
- • Wilmar International
- • Louis Dreyfus Company
- • IOI Group
- • Golden Agri-Resources
- • New Britain Palm Oil
- • Musim Mas
Companies within the industry are increasingly concentrating on broadening their market presence through a variety of strategic initiatives. These include mergers and acquisitions, as well as green investments, particularly in underdeveloped regions. Such strategies are proving instrumental in enabling these companies to capture a larger share of the market. By consolidating resources and expanding their geographical footprint, they not only enhance their competitive edge but also contribute to sustainable development in emerging markets. This approach not only fosters growth but also aligns with global trends toward environmental responsibility and corporate sustainability.
Competitive Landscape
The competitive landscape is shaped by a mix of global leaders and regional players, with large companies like Archer Daniels Midland Company, Cargill, Bunge Limited, Wilmar International, Louis Dreyfus Company, IOI Group, Golden Agri-Resources, New Britain Palm Oil, Musim Mas dominating the market through their extensive resources, innovation, and established brand presence. However, emerging players are disrupting the market with niche products and innovative technologies, challenging the incumbents. Pricing strategies vary, with larger firms benefiting from economies of scale while smaller players offer value-added services or customization. Geographical reach is key as global companies expand across regions, while regional firms focus on local markets. Strategic partnerships and mergers continue to reshape the landscape, and barriers to entry remain high due to capital requirements and regulatory hurdles.
Get the full report to explore critical industry dynamics.
Price Trend Analysis
Price trend analysis is the study of historical pricing data to identify patterns and predict future price movements. It provides businesses with insights into how prices for goods or services change over time due to factors like market demand, supply levels, economic conditions, and external influences such as inflation or raw material costs.
This analysis is critical for businesses, as it helps in developing effective pricing strategies. By understanding pricing trends, companies can adjust their prices to remain competitive while safeguarding their profit margins. For example, if a business anticipates a rise in material costs, it can adjust its pricing or production plan to mitigate the impact.
Price trend analysis is also essential for forecasting. It allows companies to predict future price fluctuations and plan accordingly, whether for purchasing, production, or sales strategies. This is particularly important for industries where price volatility is common, such as commodities or seasonal products.
Furthermore, analyzing price trends offers valuable market insights. Businesses can gain a clearer view of consumer behavior, competitor pricing tactics, and overall market health. This helps in making informed decisions about product positioning, promotions, and inventory management.
In short, price trend analysis is a crucial tool that enables businesses to remain agile, mitigate risks, and drive profitability.
Dynamics
Market dynamics refer to the forces that influence the supply and demand of products and services within a market. These forces include factors such as consumer preferences, technological advancements, regulatory changes, economic conditions, and competitive actions. Understanding market dynamics is crucial for businesses, as it helps them anticipate changes, identify opportunities, and mitigate risks.
By analyzing market dynamics, companies can better understand market trends, predict potential shifts, and develop strategic responses. This analysis enables businesses to align their product offerings, pricing strategies, and marketing efforts with evolving market conditions, ultimately leading to more informed decision-making and a stronger competitive position in the marketplace.
Market Driver
- • Increasing Global Population
Market Trend
- • Sustainable Sourcing
Opportunity
- • Increasing Global Population
Challenges
- • Price Fluctuations
Merger & Acquisition
Research Process
The research process is a systematic approach to gathering and analyzing information in order to address specific questions or hypotheses. It typically begins with identifying a problem or research question that needs exploration. Once the question is defined, researchers review existing literature to gain a deeper understanding of the subject and identify gaps that need addressing.
Next, researchers develop a research plan or methodology, outlining how data will be collected and analyzed. This may involve choosing between qualitative, quantitative, or mixed methods depending on the nature of the research. Data collection methods can include surveys, experiments, observations, or secondary data analysis.
Once data is collected, the next step is analyzing the information using appropriate tools or techniques, such as statistical software for quantitative data or thematic analysis for qualitative data. This analysis helps draw conclusions and identify patterns relevant to the research question.
Finally, the findings are interpreted and communicated through reports, presentations, or publications. The results are often compared against the initial hypotheses, and limitations or further areas of study are highlighted. This structured process ensures that research is rigorous, transparent, and reliable, contributing valuable insights to the field of study.
|
Report Features |
Details |
|
Base Year |
2025 |
|
Based Year Market Size (2019) |
70 billion |
|
Historical Period Market Size (2024) |
USD Million ZZ |
|
CAGR (2025 to 2030) |
5.00% |
|
Forecast Period |
2025 to 2030 |
|
Forecasted Period Market Size (2030) |
100 billion |
|
Scope of the Report |
Refined Soy Oil, Crude Soy Oil, Palm Kernel Oil, Crude Palm Oil, RBD Palm Oil, Food Processing, Cooking, Biodiesel Production, Cosmetics, Industrial Applications |
|
Regions Covered |
North America, Europe, Asia Pacific, South America, and MEA |
|
Year-on-Year Growth |
4.00% |
|
Companies Covered |
Archer Daniels Midland Company, Cargill, Bunge Limited, Wilmar International, Louis Dreyfus Company, IOI Group, Golden Agri-Resources, New Britain Palm Oil, Musim Mas |
|
Customization Scope |
15% Free Customization (For EG) |
|
Delivery Format |
PDF and Excel through Email |
Soy Oil & Palm Oil - Table of Contents
Chapter 1: Market Preface
Chapter 2: Strategic Overview
Chapter 3: Global Soy Oil & Palm Oil Market Business Environment & Changing Dynamics
Chapter 4: Global Soy Oil & Palm Oil Industry Factors Assessment
Chapter 5: Soy Oil & Palm Oil : Competition Benchmarking & Performance Evaluation
Chapter 6: Global Soy Oil & Palm Oil Market: Company Profiles
Chapter 7: Global Soy Oil & Palm Oil by Type & Application (2024-2030)
Chapter 8: North America Soy Oil & Palm Oil Market Breakdown by Country, Type & Application
Chapter 9: Europe Soy Oil & Palm Oil Market Breakdown by Country, Type & Application
Chapter 10: Asia Pacific Soy Oil & Palm Oil Market Breakdown by Country, Type & Application
Chapter 11: Latin America Soy Oil & Palm Oil Market Breakdown by Country, Type & Application
Chapter 12: Middle East & Africa Soy Oil & Palm Oil Market Breakdown by Country, Type & Application
Chapter 13: Research Finding and Conclusion
Frequently Asked Questions (FAQ):
The Compact Track Loaders market is expected to see value worth 5.3 Billion in 2025.
North America currently leads the market with approximately 45% market share, followed by Europe at 28% and Asia-Pacific at 22%. The remaining regions account for 5% of the global market.
Key growth drivers include increasing construction activities, rising demand for versatile equipment in agriculture, technological advancements in track loader design, and growing preference for compact equipment in urban construction projects.