
Cross-Border Capital Flows Market Research Report
Global Cross-Border Capital Flows Market Scope & Changing Dynamics 2025-2033
Global Cross-Border Capital Flows Market is segmented by Application (Global Finance, Real Estate, Corporate Debt, Equity Markets, Government Bonds), Type (Foreign Direct Investment (FDI), Foreign Portfolio Investment (FPI), Remittances, Trade Finance, International Loans), and Geography (North America, LATAM, West Europe, Central & Eastern Europe, Northern Europe, Southern Europe, East Asia, Southeast Asia, South Asia, Central Asia, Oceania, MEA)
Pricing
Report Overview
Rising globalization_Growth in multinational corporations_Increasing need for diversification_Global liquidity availability_Demand for investment in emerging markets
A market research report provides businesses with crucial insights into a specific industry, product, or market. The report typically begins with an executive summary, offering a concise overview of key findings and strategic recommendations. It then delves into the market overview, analysing the current size, growth trends, and key drivers that influence market dynamics. Segmentation is another critical aspect, breaking down the market by product type, end-users, and geographic regions to offer a more focused analysis.
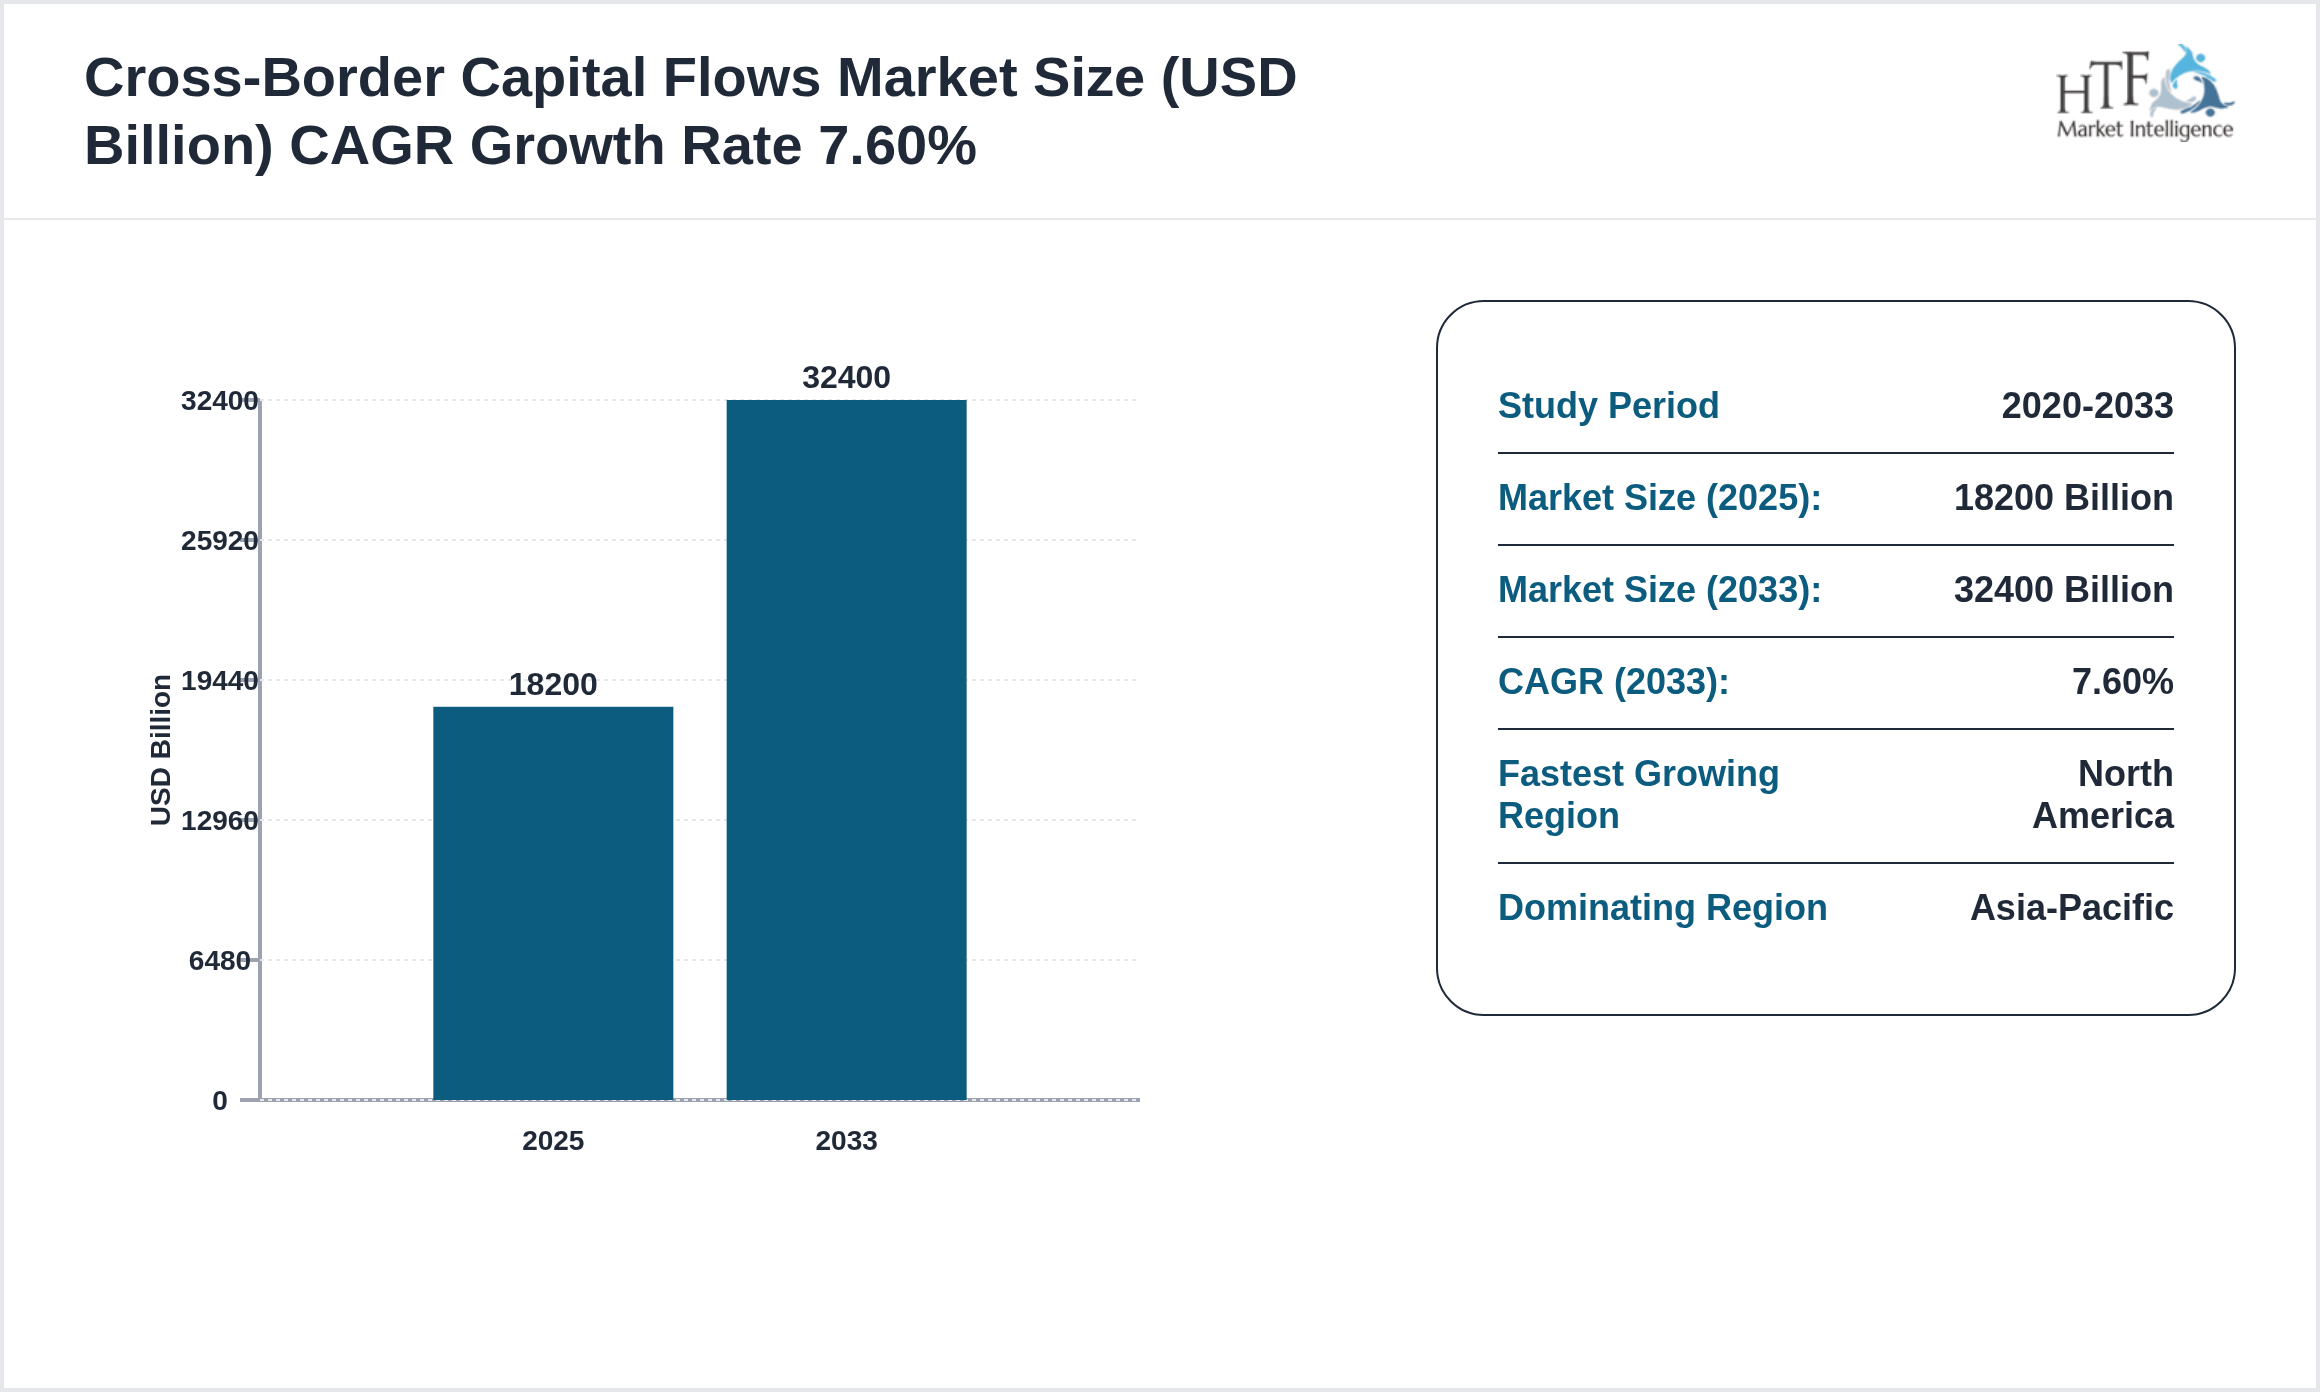
The Cross-Border Capital Flows market is experiencing robust growth, projected to achieve a compound annual growth rate CAGR of 7.60% during the forecast period. Valued at 18.2 Trillion, the market is expected to reach 32.4 Trillion by 2033, with a year-on-year growth rate of 5.90%.
The competitive landscape section outlines the key players, their strategies, market share, and a SWOT analysis, which aids businesses in understanding the competition and identifying opportunities for differentiation. Additionally, the report includes forecasts and emerging trends, providing data-driven projections that help businesses anticipate future market shifts. Finally, the report concludes with actionable recommendations, helping organizations make informed decisions and align strategies with market opportunities.
Cross-Border Capital Flows Market Dynamics
Influencing Trend:
The Cross-Border Capital Flows market is expanding due to:
Market Growth Drivers:
The report is able to determine and examine the elements propelling the Cross-Border Capital Flows market's expansion.
Challenges:
The research highlight the challenges faced by the industry, including
Opportunities:
The research concludes with suggestions for investors, legislators, and industry participants. It draws attention to prospective opportunities.
Q&A in Our Report
A market research report addresses several key questions that are essential for strategic business planning. It first examines the market size and growth potential, helping businesses understand current opportunities and future expansion possibilities. It also explores the key drivers and challenges influencing the market, providing insight into factors that stimulate demand or create barriers to entry. Additionally, the report analyzes leading competitors and their strategies, giving businesses a clearer picture of the competitive landscape and potential areas for differentiation. By identifying major market trends, the report helps companies stay ahead of industry shifts and innovate accordingly. It also delves into key market segments, offering a more focused analysis based on product type, geography, or customer demographics. Lastly, the report provides future growth forecasts, enabling businesses to make informed long-term strategic decisions and investment plans based on predictive market analysis.
Get Sample PDF Including (Statistical Data, Charts & Key Players)
Key Highlights
• The Cross-Border Capital Flows is growing at a CAGR of 7.60% during the forecasted period of 2025 to 2033
• Year on Year growth for the market is 5.90%
• North America dominated the market share of 18.2 Trillion in 2025
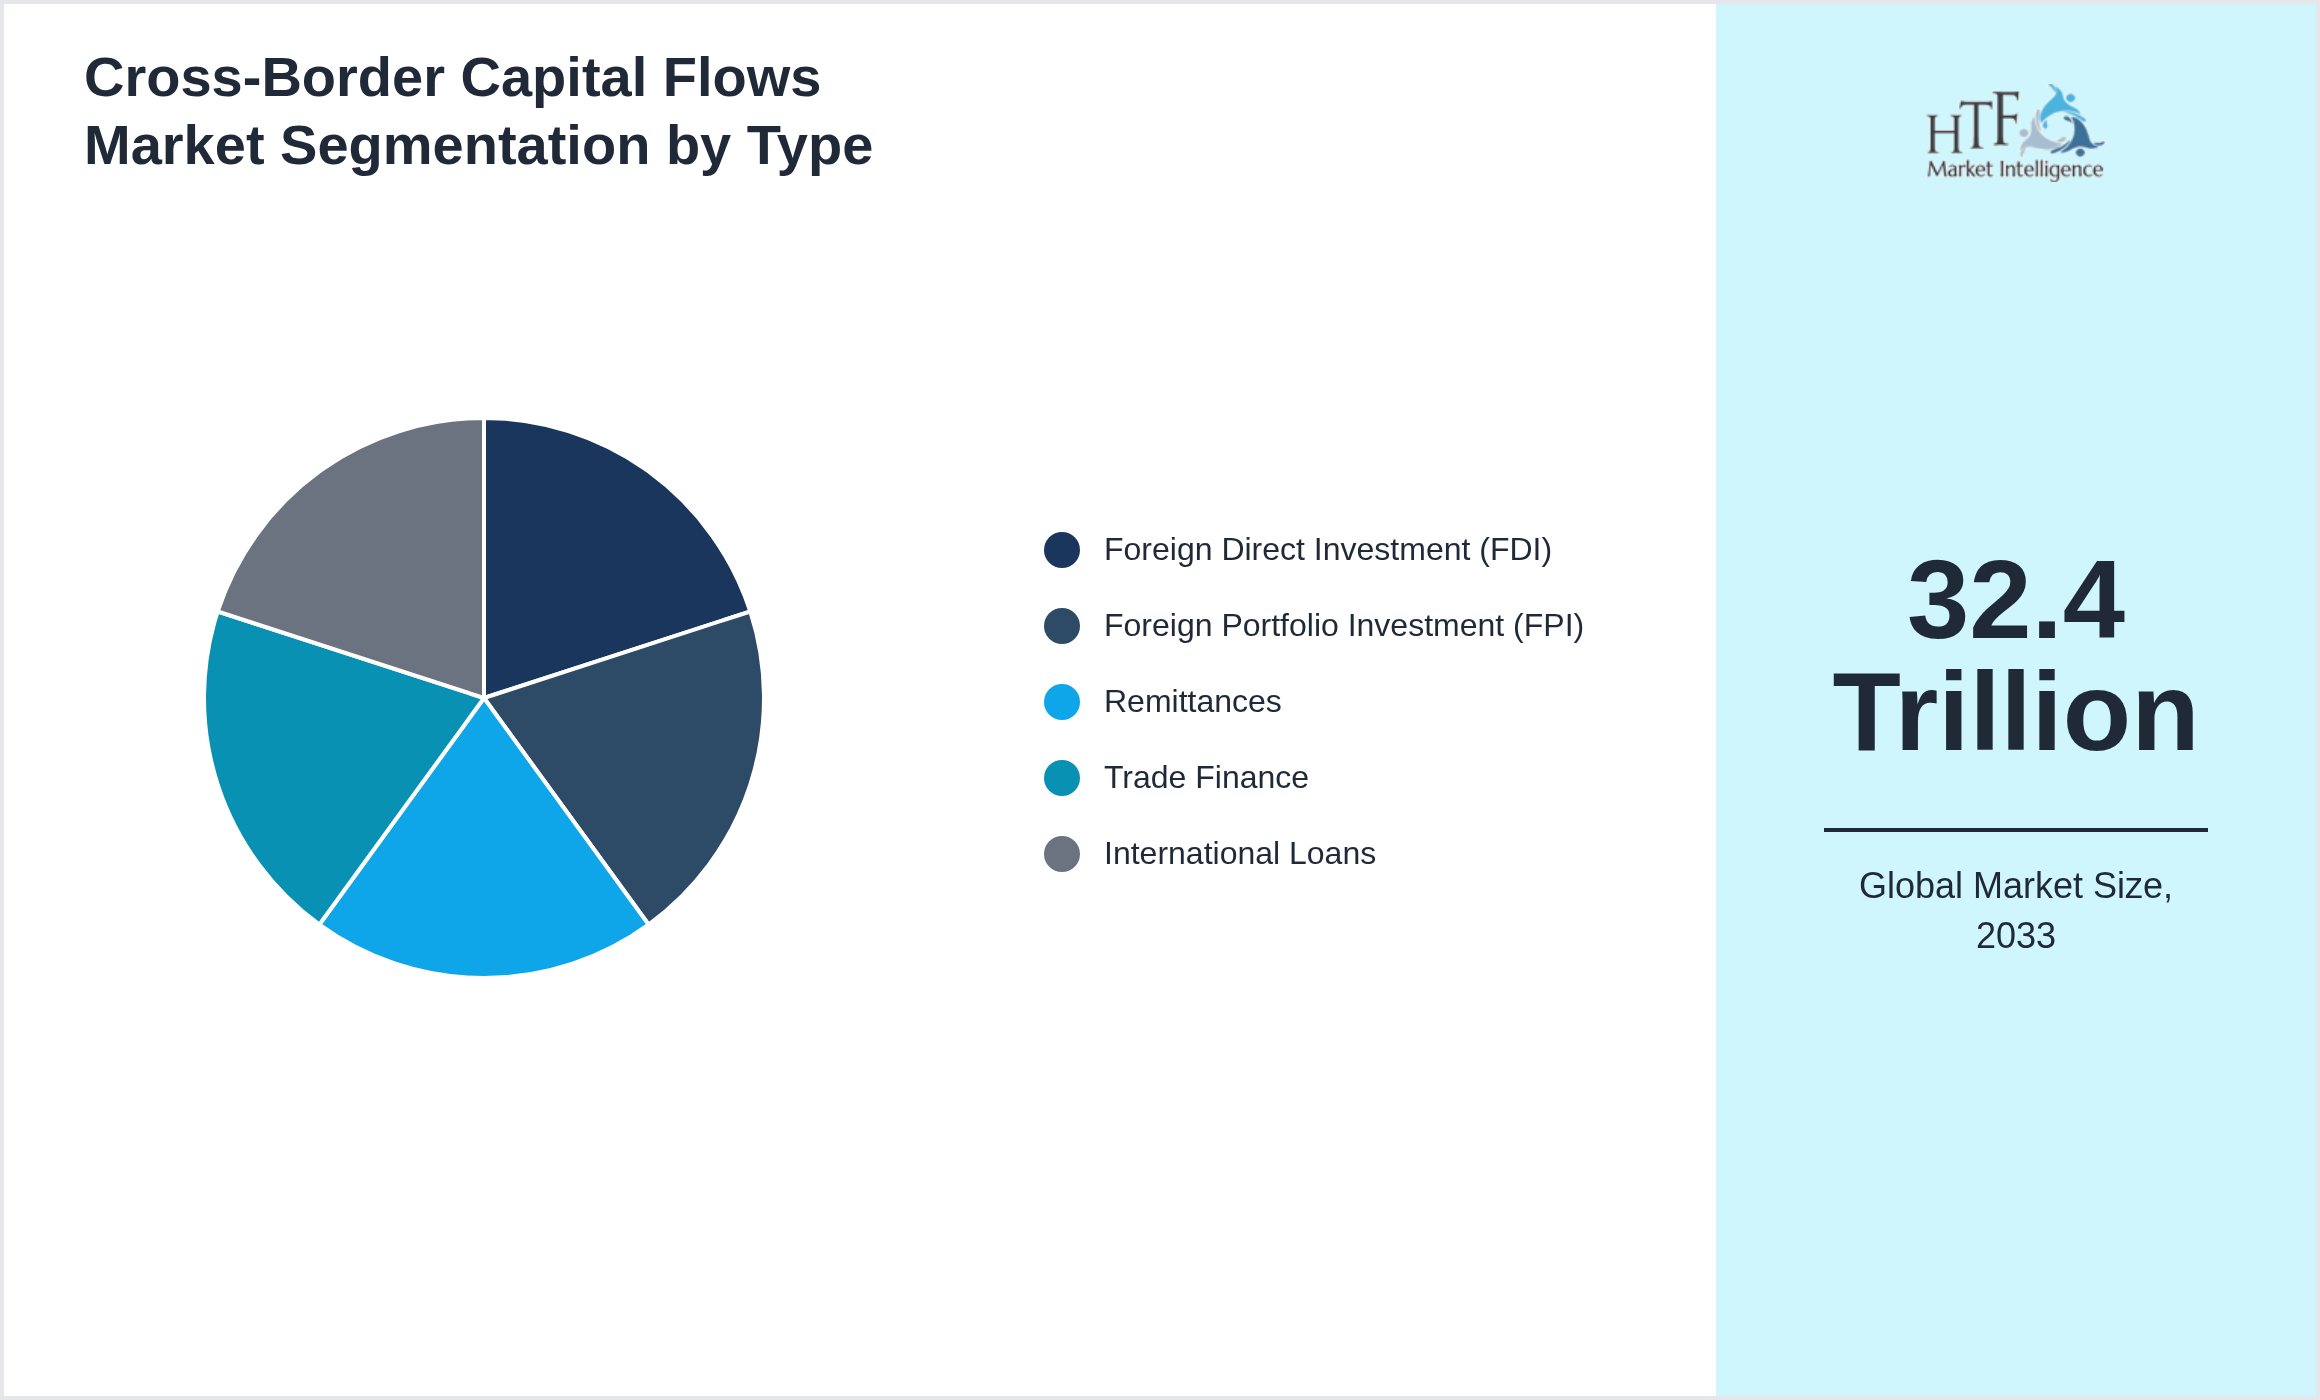
• Based on type, the market is bifurcated into Foreign Direct Investment (FDI), Foreign Portfolio Investment (FPI), Remittances, Trade Finance, International Loans segment, which dominated the market share during the forecasted period
Market Segmentation
The market is segmented by Type and Application, offering a comprehensive understanding of how different product categories and end-use cases contribute to the overall market landscape. This segmentation helps businesses pinpoint specific areas of opportunity and tailor their strategies accordingly.
Segmentation by Type
- • Foreign Direct Investment (FDI)
- • Foreign Portfolio Investment (FPI)
- • Remittances
- • Trade Finance
- • International Loans
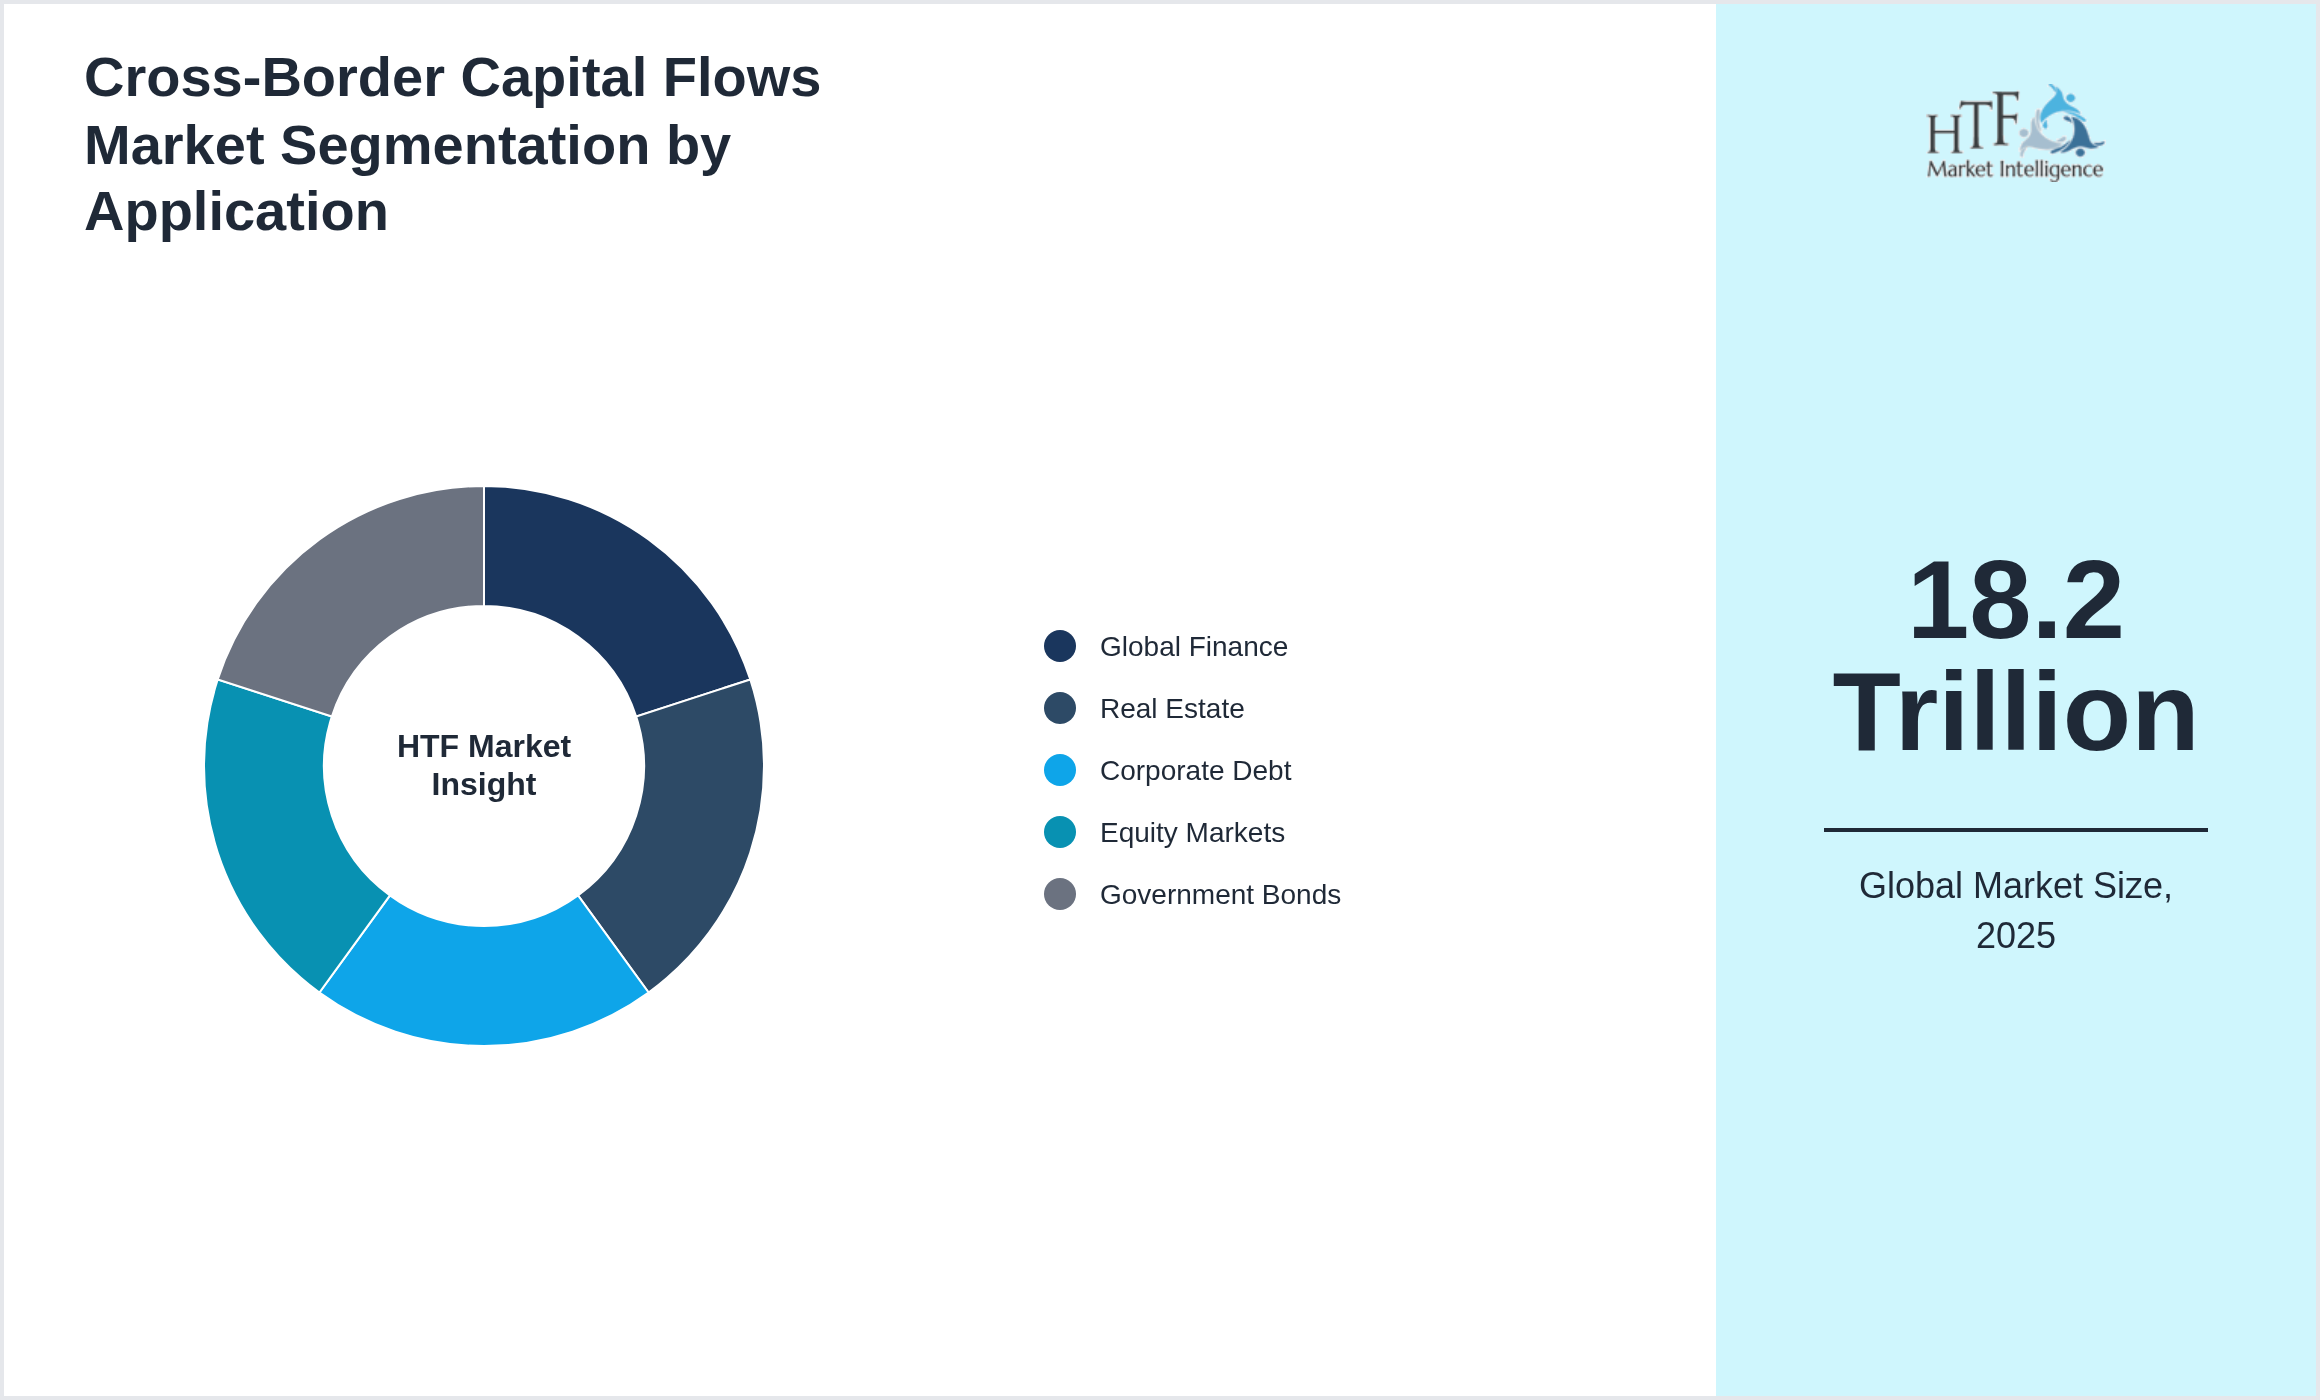
Segmentation by Application
- • Global Finance
- • Real Estate
- • Corporate Debt
- • Equity Markets
- • Government Bonds
This report also analyzes the market by region, providing insights into geographical differences in market performance.
- North America
- LATAM
- West Europe
- Central & Eastern Europe
- Northern Europe
- Southern Europe
- East Asia
- Southeast Asia
- South Asia
- Central Asia
- Oceania
- MEA
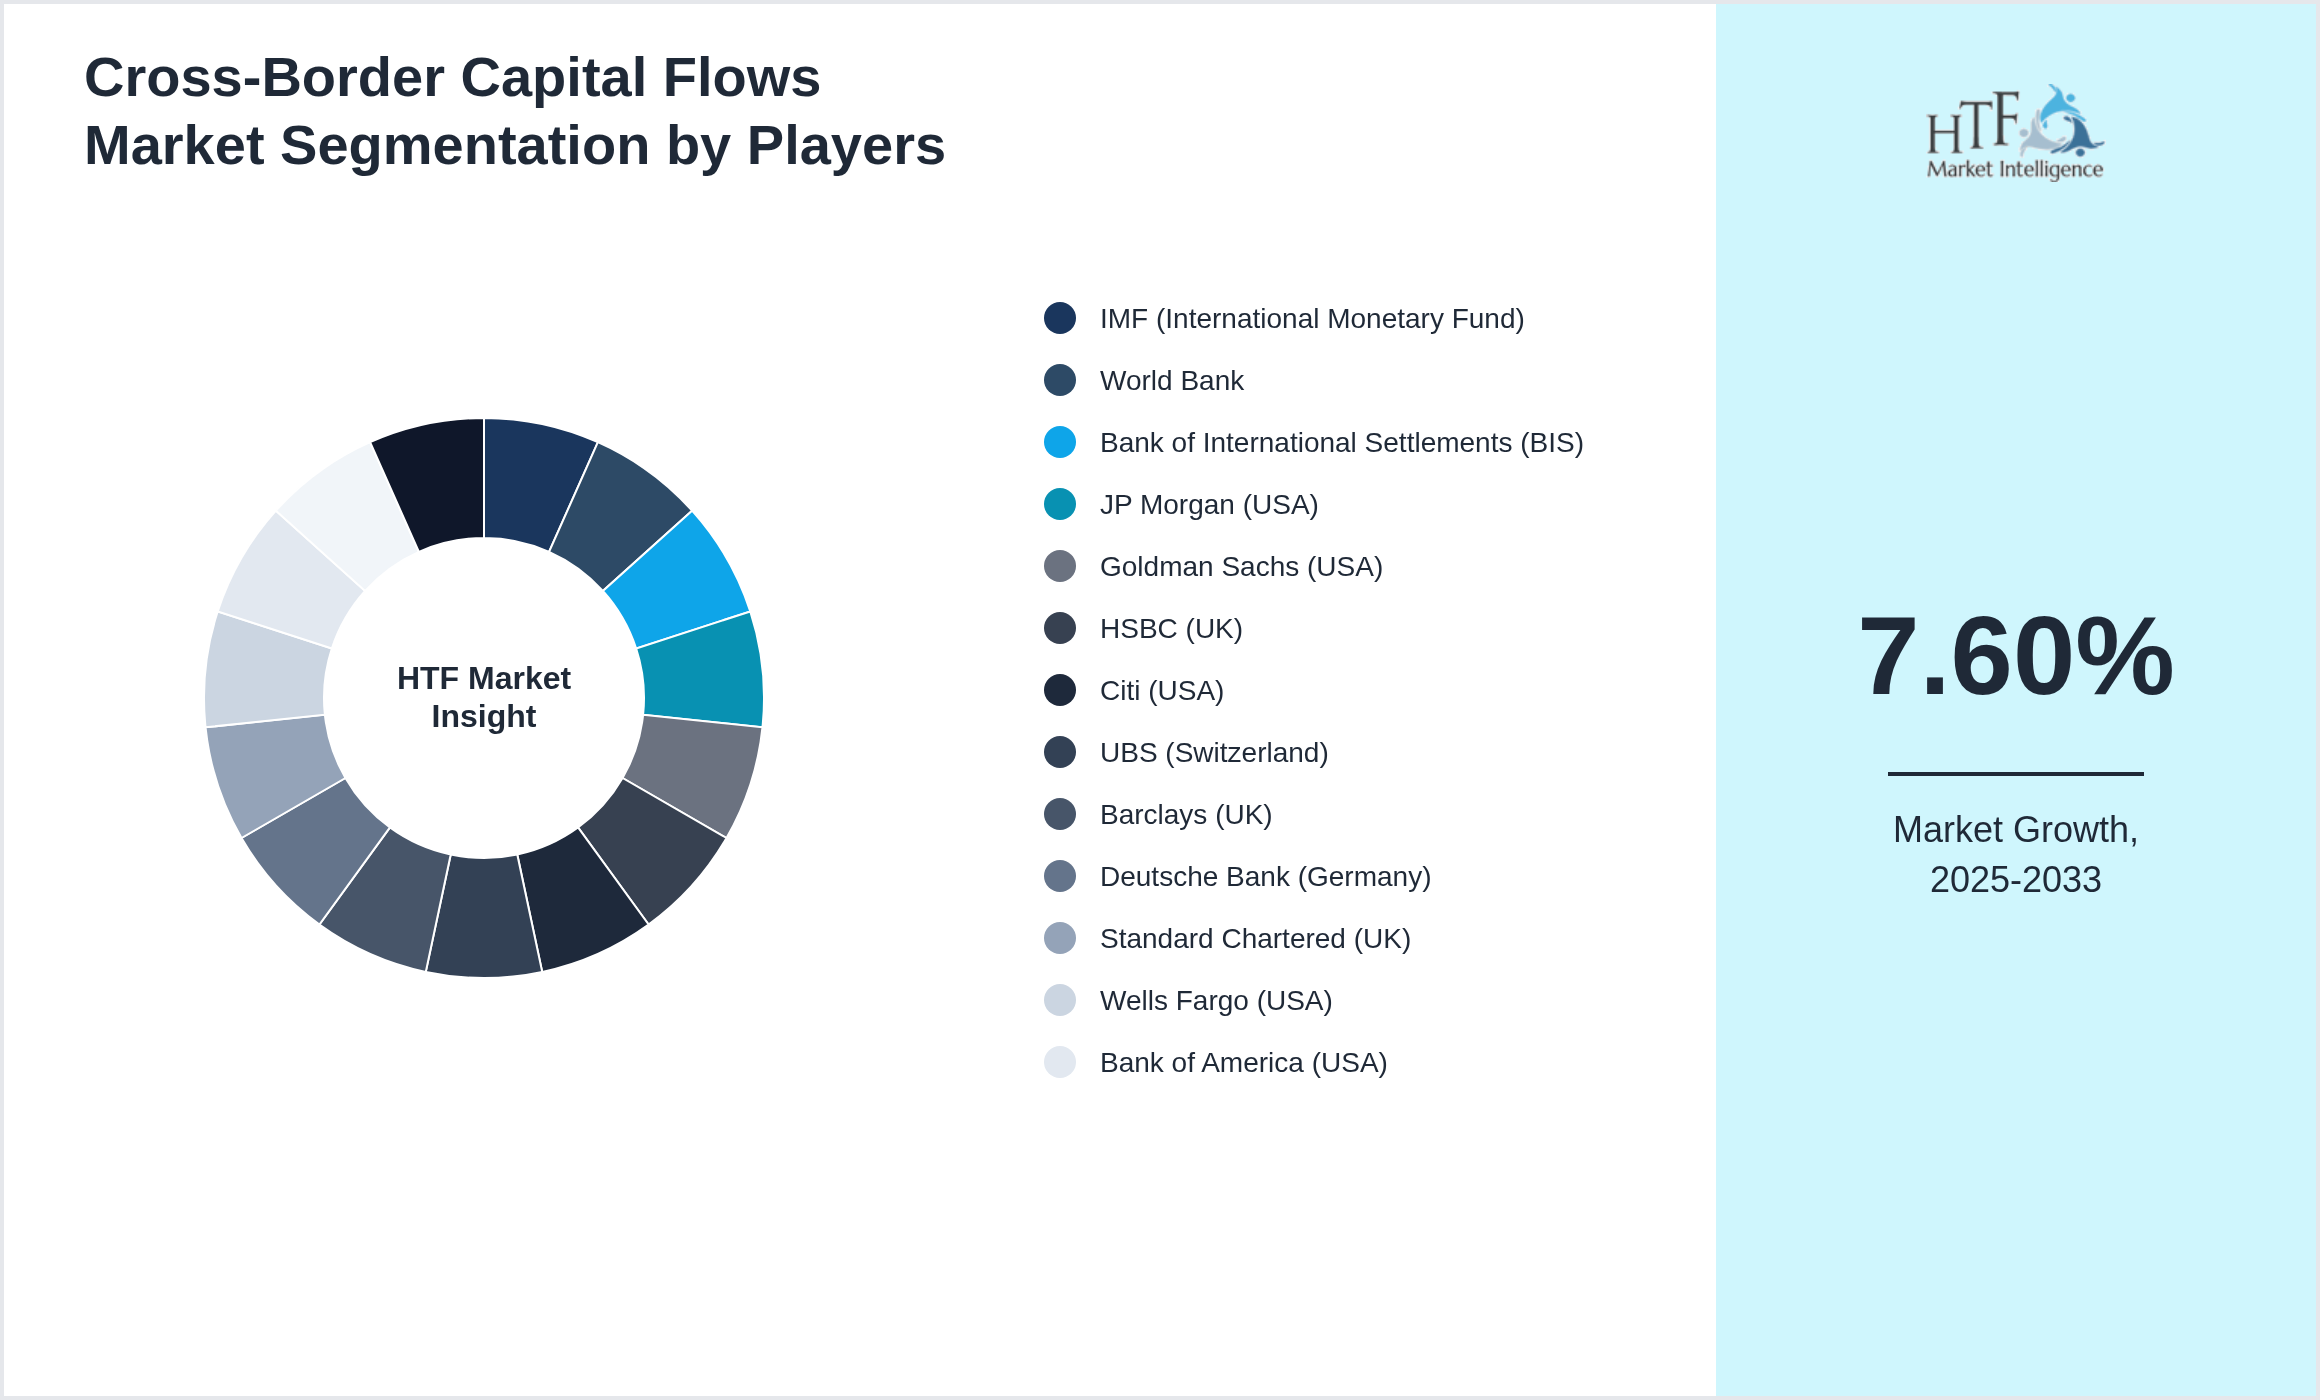
Key Players
The companies profiled were selected based on insights from industry experts and a thorough evaluation of their market influence, product range, and geographical presence. Companies are increasingly focused on expanding their market share through strategic initiatives such as mergers, acquisitions, and green investments, particularly in underserved regions. These strategies are helping companies capture a larger market share while fostering sustainable development. By consolidating resources and widening their geographical reach, these companies not only enhance their competitive position but also align with global trends in sustainability and corporate responsibility.
- • IMF (International Monetary Fund)
- • World Bank
- • Bank of International Settlements (BIS)
- • JP Morgan (USA)
- • Goldman Sachs (USA)
- • HSBC (UK)
- • Citi (USA)
- • UBS (Switzerland)
- • Barclays (UK)
- • Deutsche Bank (Germany)
- • Standard Chartered (UK)
- • Wells Fargo (USA)
- • Bank of America (USA)
- • BNP Paribas (France)
- • ING (Netherlands)
Regional Outlook
Factors driving this growth include technological advancements, growing consumer demand, and globalization. Businesses looking to capitalize on these trends should focus on product innovation, digital marketing, and market expansion to enhance revenue and market reach.
The North America is expected to witness the fastest growth due to its rising population and expanding economic activities across key sectors. Urbanization, infrastructure development, and supportive government policies are fueling this growth, supported by a young and dynamic workforce. Meanwhile, Asia-Pacific remains a leader, driven by well-established industries, technological innovation, and strong global influence.
• North America leads in technology, healthcare, and aerospace, with a focus on renewable energy and electric vehicles as part of its decarbonization efforts.
• Europe excels in automotive, renewable energy, and luxury goods, with investments in green hydrogen, offshore wind, and digital transformation.
• Asia-Pacific is dominant in manufacturing, semiconductors, and fintech, while investing heavily in 5G, AI, and smart city projects alongside renewable energy expansion.
• Latin America thrives in agriculture, commodities, and mining, focusing on infrastructure and the digital economy to drive growth.
• The Middle East and Africa remain centered on oil and gas but are increasingly diversifying into renewable energy and digital sectors, with Africa also seeing investments in healthcare and education.
tag
Regional Analysis
- • US and China remain key players. India and Brazil attract record inflows. EU balances inflow-outflow ratios. MENA
- • April 2024 – World Bank and IMF reported increased cross-border capital flows driven by international infrastructure projects and growth in emerging markets.
- • April
- • FATF
- • Not a traditional patent domain. Cross-border fintech platforms may hold IP in compliance automation
- • Sovereign wealth funds and global VCs drive flows. Fintechs enable seamless capital movement. Crypto-related cross-border flows draw mixed regulatory reactions.
Report Infographics
|
Report Features |
Details |
|
Base Year |
2025 |
|
Based Year Market Size (2025) |
18.2 Trillion |
|
Historical Period |
2020 to 2025 |
|
CAGR (2025 to 2033) |
7.60% |
|
Forecast Period |
2025 to 2033 |
|
Forecasted Period Market Size (2033) |
2033 |
|
Scope of the Report |
Foreign Direct Investment (FDI), Foreign Portfolio Investment (FPI), Remittances, Trade Finance, International Loans, Global Finance, Real Estate, Corporate Debt, Equity Markets, Government Bonds |
|
Regions Covered |
North America, LATAM, West Europe, Central & Eastern Europe, Northern Europe, Southern Europe, East Asia, Southeast Asia, South Asia, Central Asia, Oceania, MEA |
|
Companies Covered |
IMF (International Monetary Fund), World Bank, Bank of International Settlements (BIS), JP Morgan (USA), Goldman Sachs (USA), HSBC (UK), Citi (USA), UBS (Switzerland), Barclays (UK), Deutsche Bank (Germany), Standard Chartered (UK), Wells Fargo (USA), Bank of America (USA), BNP Paribas (France), ING (Netherlands) |
|
Customization Scope |
15% Free Customization (For EG) |
|
Delivery Format |
PDF and Excel through Email |
Regulatory Framework of Market Research Reports
The regulatory framework governing market research reports ensures transparency, accuracy, and ethical conduct in data collection and reporting. Compliance with relevant legal and industry standards is critical to maintaining credibility and avoiding penalties.
- Data Privacy and Protection: Regulations such as the General Data Protection Regulation (GDPR) in the EU and the California Consumer Privacy Act (CCPA) in the US mandate strict guidelines for handling personal data. Market research firms must ensure that all data collection methods comply with privacy laws, including obtaining consent and ensuring data security.
- Fair Competition: Regulatory bodies such as the Federal Trade Commission (FTC) in the US and the Competition and Markets Authority (CMA) in the UK enforce fair competition practices. Research reports must avoid biased or misleading information that could distort competition or consumer choice.
- Intellectual Property: Compliance with copyright laws ensures that the content used in market research reports, such as proprietary data or third-party insights, is legally sourced and cited to avoid infringement.
- Ethical Standards: Industry organizations, like the Market Research Society (MRS) and the American Association for Public Opinion Research (AAPOR), set ethical guidelines that dictate transparent, responsible research practices, ensuring that respondents’ rights are respected and findings are presented without manipulation.
Cross-Border Capital Flows - Table of Contents
Chapter 1: Market Preface
Chapter 2: Strategic Overview
Chapter 3: Global Cross-Border Capital Flows Market Business Environment & Changing Dynamics
Chapter 4: Global Cross-Border Capital Flows Industry Factors Assessment
Chapter 5: Cross-Border Capital Flows : Competition Benchmarking & Performance Evaluation
Chapter 6: Global Cross-Border Capital Flows Market: Company Profiles
Chapter 7: Global Cross-Border Capital Flows by Type & Application (2020-2033)
Chapter 8: North America Cross-Border Capital Flows Market Breakdown by Country, Type & Application
Chapter 9: Europe Cross-Border Capital Flows Market Breakdown by Country, Type & Application
Chapter 10: Asia Pacific Cross-Border Capital Flows Market Breakdown by Country, Type & Application
Chapter 11: Latin America Cross-Border Capital Flows Market Breakdown by Country, Type & Application
Chapter 12: Middle East & Africa Cross-Border Capital Flows Market Breakdown by Country, Type & Application
Chapter 13: Research Finding and Conclusion
Frequently Asked Questions (FAQ):
The Compact Track Loaders market is expected to see value worth 5.3 Billion in 2025.
North America currently leads the market with approximately 45% market share, followed by Europe at 28% and Asia-Pacific at 22%. The remaining regions account for 5% of the global market.
Key growth drivers include increasing construction activities, rising demand for versatile equipment in agriculture, technological advancements in track loader design, and growing preference for compact equipment in urban construction projects.