
Electronic Specialty Gases Market Research Report
Global Electronic Specialty Gases Market Size, Growth & Revenue 2024-2033
Global Electronic Specialty Gases Market is segmented by Application (Semiconductors, Display Panels, Solar Cells, Photonics, Industrial Electronics), Type (High-Purity Gases, Specialty Process Gases, Electronic Grade Nitrogen, Specialty Etching Gases, Carrier Gases), and Geography (North America, LATAM, West Europe, Central & Eastern Europe, Northern Europe, Southern Europe, East Asia, Southeast Asia, South Asia, Central Asia, Oceania, MEA)
Pricing
Industry Overview
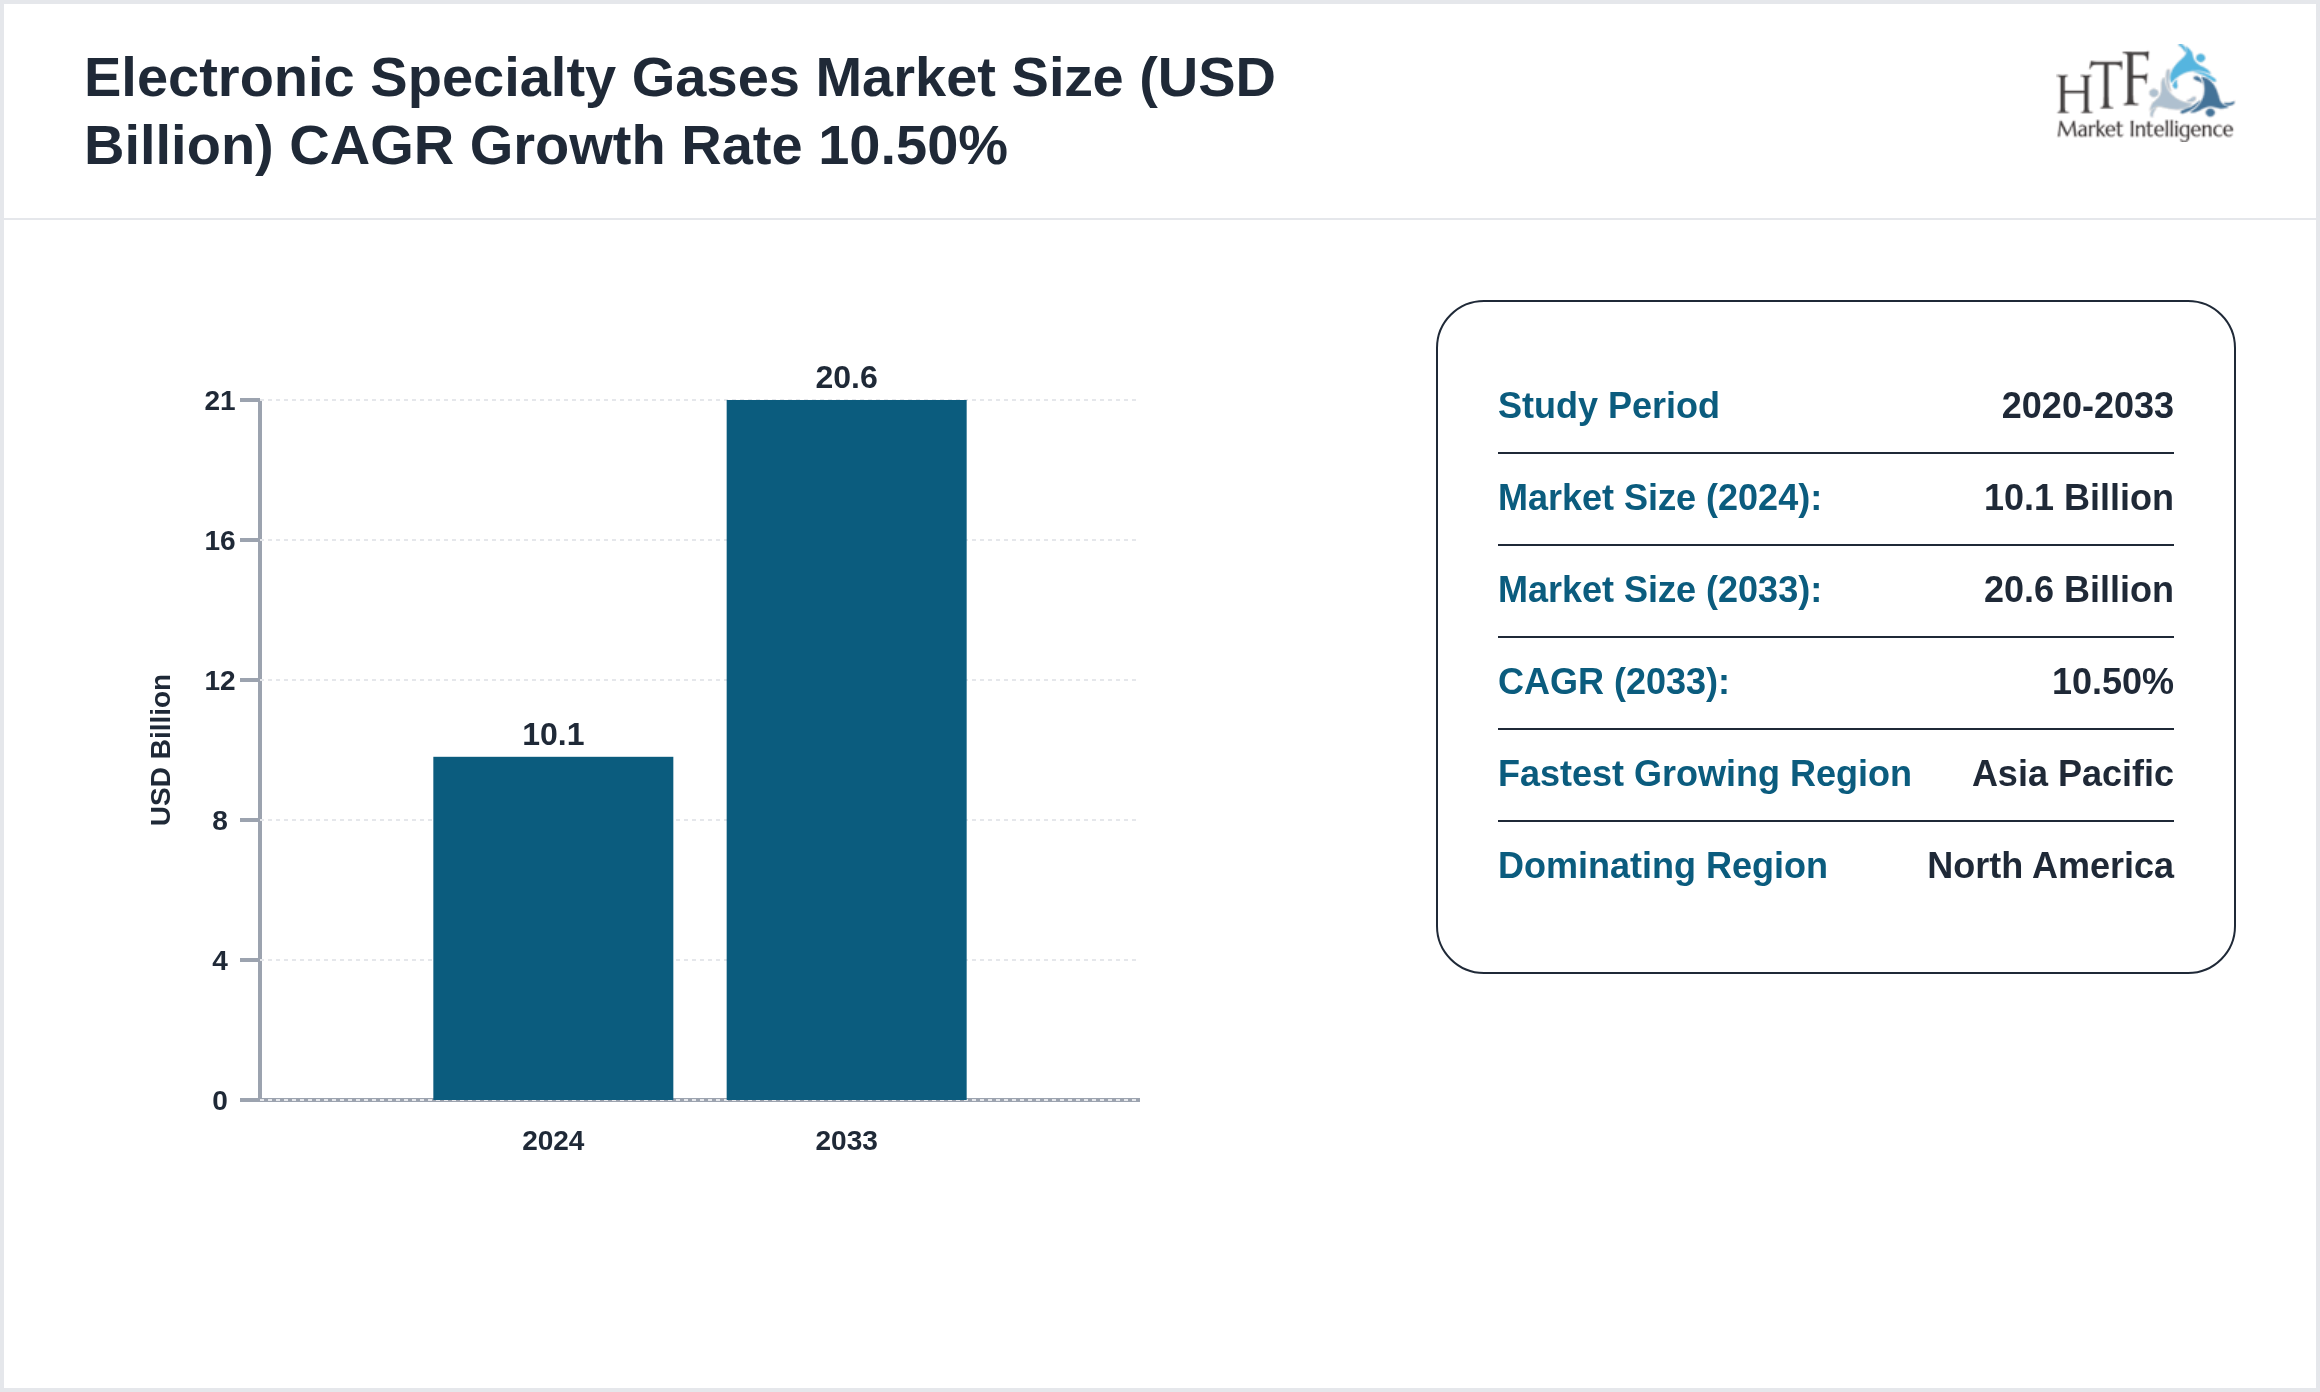
According to the HTF Market Report, the Electronic Specialty Gases market is expected to see a growth of 10.50% and may reach a market size of 20.6 billion by 2033, currently valued at 10.1 billion.
Electronic specialty gases are ultra-pure or specialty chemical gases used in semiconductor manufacturing, display panels, and other advanced electronics. They are critical in processes such as etching, deposition, and doping. High-purity gases ensure device quality, yield, and performance. The market is driven by growth in semiconductors, flat-panel displays, and photonics applications, along with increasing adoption of energy-efficient and environmentally friendly gas solutions.
The chemical industry is a building block of the world's economy, driving innovation in sectors like pharmaceuticals and agriculture. It covers the production of base materials, including chemicals, polymers, and specialty compounds, integral to practically all products and processes. Companies in this sector are primary actors in supply chains, ensuring raw materials for manufacturing, construction, and consumer goods. With a focus on sustainability, the industry is increasingly investing in green chemistry and circular economy initiatives to reduce environmental impact. This industry will continue to grow with technological advancements, regulatory compliance, and market demand for more sustainable and innovative solutions; hence, it is energetic and a significant contributor in the business arena.
Key Player Analysis
The key players in the Electronic Specialty Gases are intensifying their focus on research and development (R&D) activities to innovate and stay competitive. Major companies, such as Linde (Germany), Air Liquide (France), Praxair (US), Matheson (US), Air Products (US), Taiyo Nippon Sanso (Japan), Iwatani (Japan), Messer Group (Germany), Nippon Gases (Japan), Showa Denko (Japan), SOL Group (US), SAPREF (South Africa), BOC Gases (Australia), Koura (US), Union Gas (Canada) are heavily investing in R&D to develop new products and improve existing ones. This strategic emphasis on innovation is driving significant advancements in product formulation and the introduction of sustainable and eco-friendly products.
Additionally, these industry leaders are actively acquiring smaller companies to broaden their regional presence and strengthen their market share. These acquisitions not only diversify product portfolios but also provide access to new technologies and markets, fostering growth within the Electronic Specialty Gases through operational streamlining and cost reduction.
Moreover, there is a clear shift toward green investments, with companies allocating more resources to sustainable practices and the development of environmentally friendly products. This response to increasing consumer demand for sustainable solutions and stricter environmental regulations positions these companies as leaders in green chemistry, further driving market growth.
The companies highlighted in this profile were selected based on insights from primary experts and an evaluation of their market penetration, product offerings, and geographical reach. We also include recent years' innovation and strategies followed by companies who are growing in the market:
- • Linde (Germany)
- • Air Liquide (France)
- • Praxair (US)
- • Matheson (US)
- • Air Products (US)
- • Taiyo Nippon Sanso (Japan)
- • Iwatani (Japan)
- • Messer Group (Germany)
- • Nippon Gases (Japan)
- • Showa Denko (Japan)
- • SOL Group (US)
- • SAPREF (South Africa)
- • BOC Gases (Australia)
- • Koura (US)
- • Union Gas (Canada)
Regional Insights
The chemical industry exhibits significant regional variation, driven by factors such as resource availability, regulatory environments, and economic conditions. In North America, the industry is maintained by abundant natural resources, particularly shale gas, which provides a competitive advantage in petrochemical production. The U.S. remains a key player, with ongoing investments in advanced manufacturing technologies and sustainable practices positioning the region as a leader in innovation.
In Europe, stringent environmental regulations and a strong emphasis on sustainability are shaping the chemical industry. The European Green Deal is pushing companies toward greener production methods, fostering growth in bio-based chemicals and recycling initiatives. Despite these opportunities, the region faces challenges from high energy costs and regulatory pressures, which are driving companies to seek efficiencies and explore new markets.
Asia-Pacific is the fastest-growing region, fuelled by rapid industrialization, urbanization, and a growing middle class. China dominates the regional market, supported by substantial investments in infrastructure and innovation. India and Southeast Asia are also emerging as key players, with increasing demand for chemicals in agriculture, construction, and electronics sectors.
Overall, regional dynamics in the chemical industry are shaped by local market conditions, regulatory landscapes, and the global push for sustainability, leading to diverse growth opportunities across different markets.
This report also splits the market by region
- North America
- LATAM
- West Europe
- Central & Eastern Europe
- Northern Europe
- Southern Europe
- East Asia
- Southeast Asia
- South Asia
- Central Asia
- Oceania
- MEA
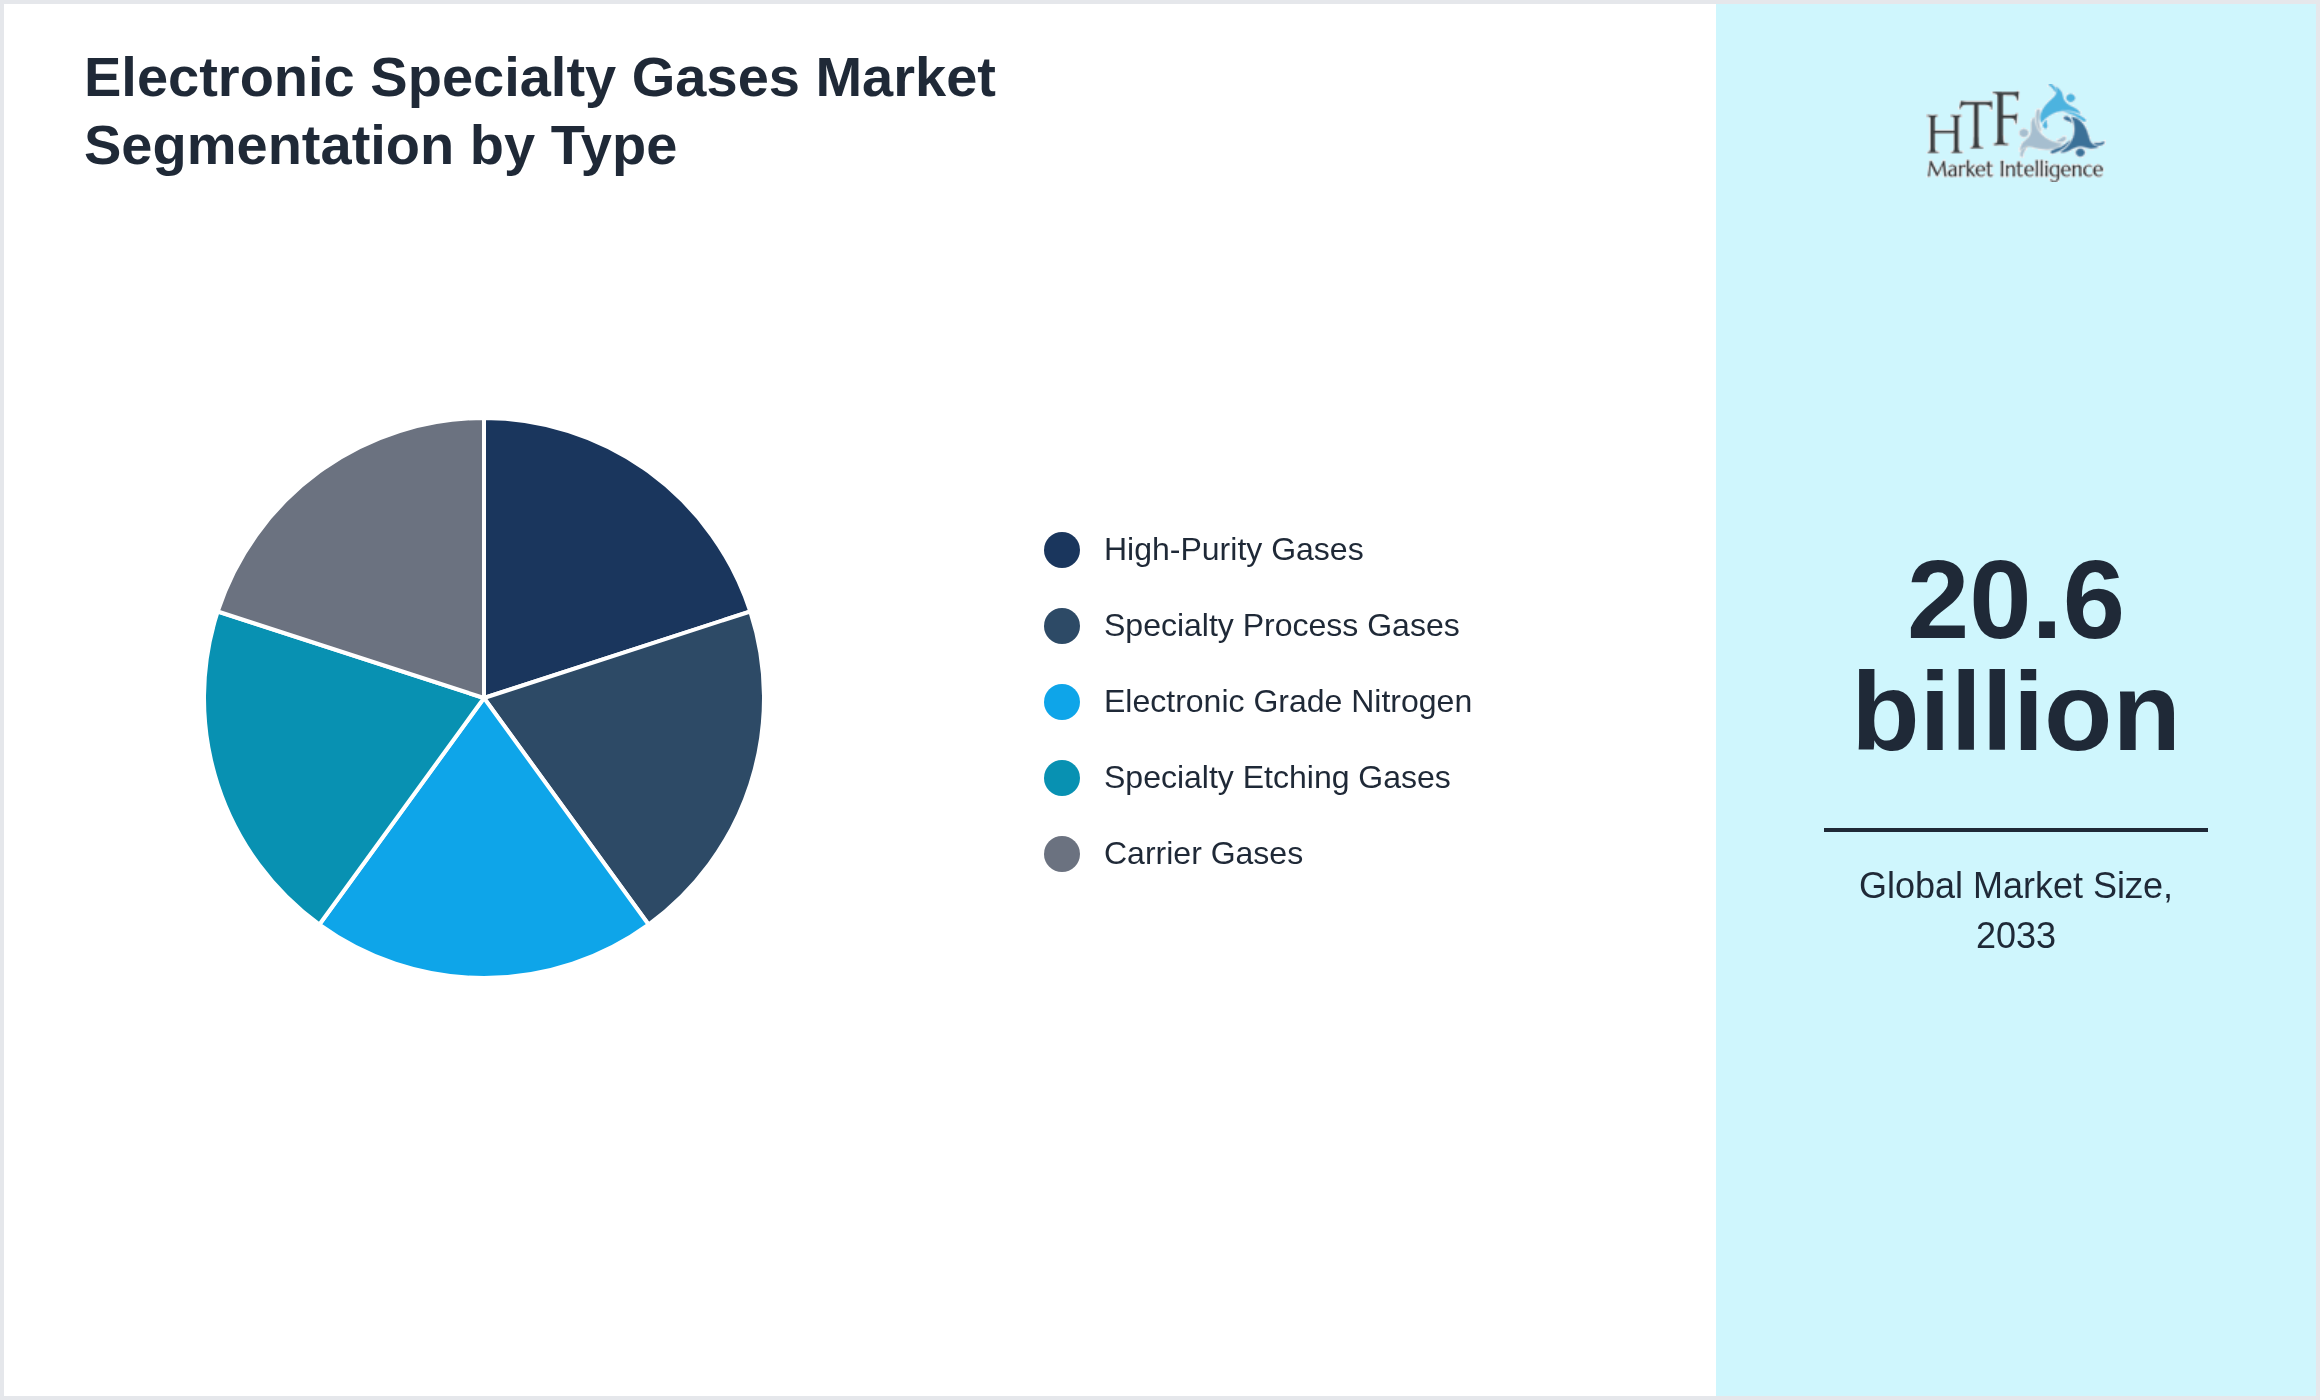
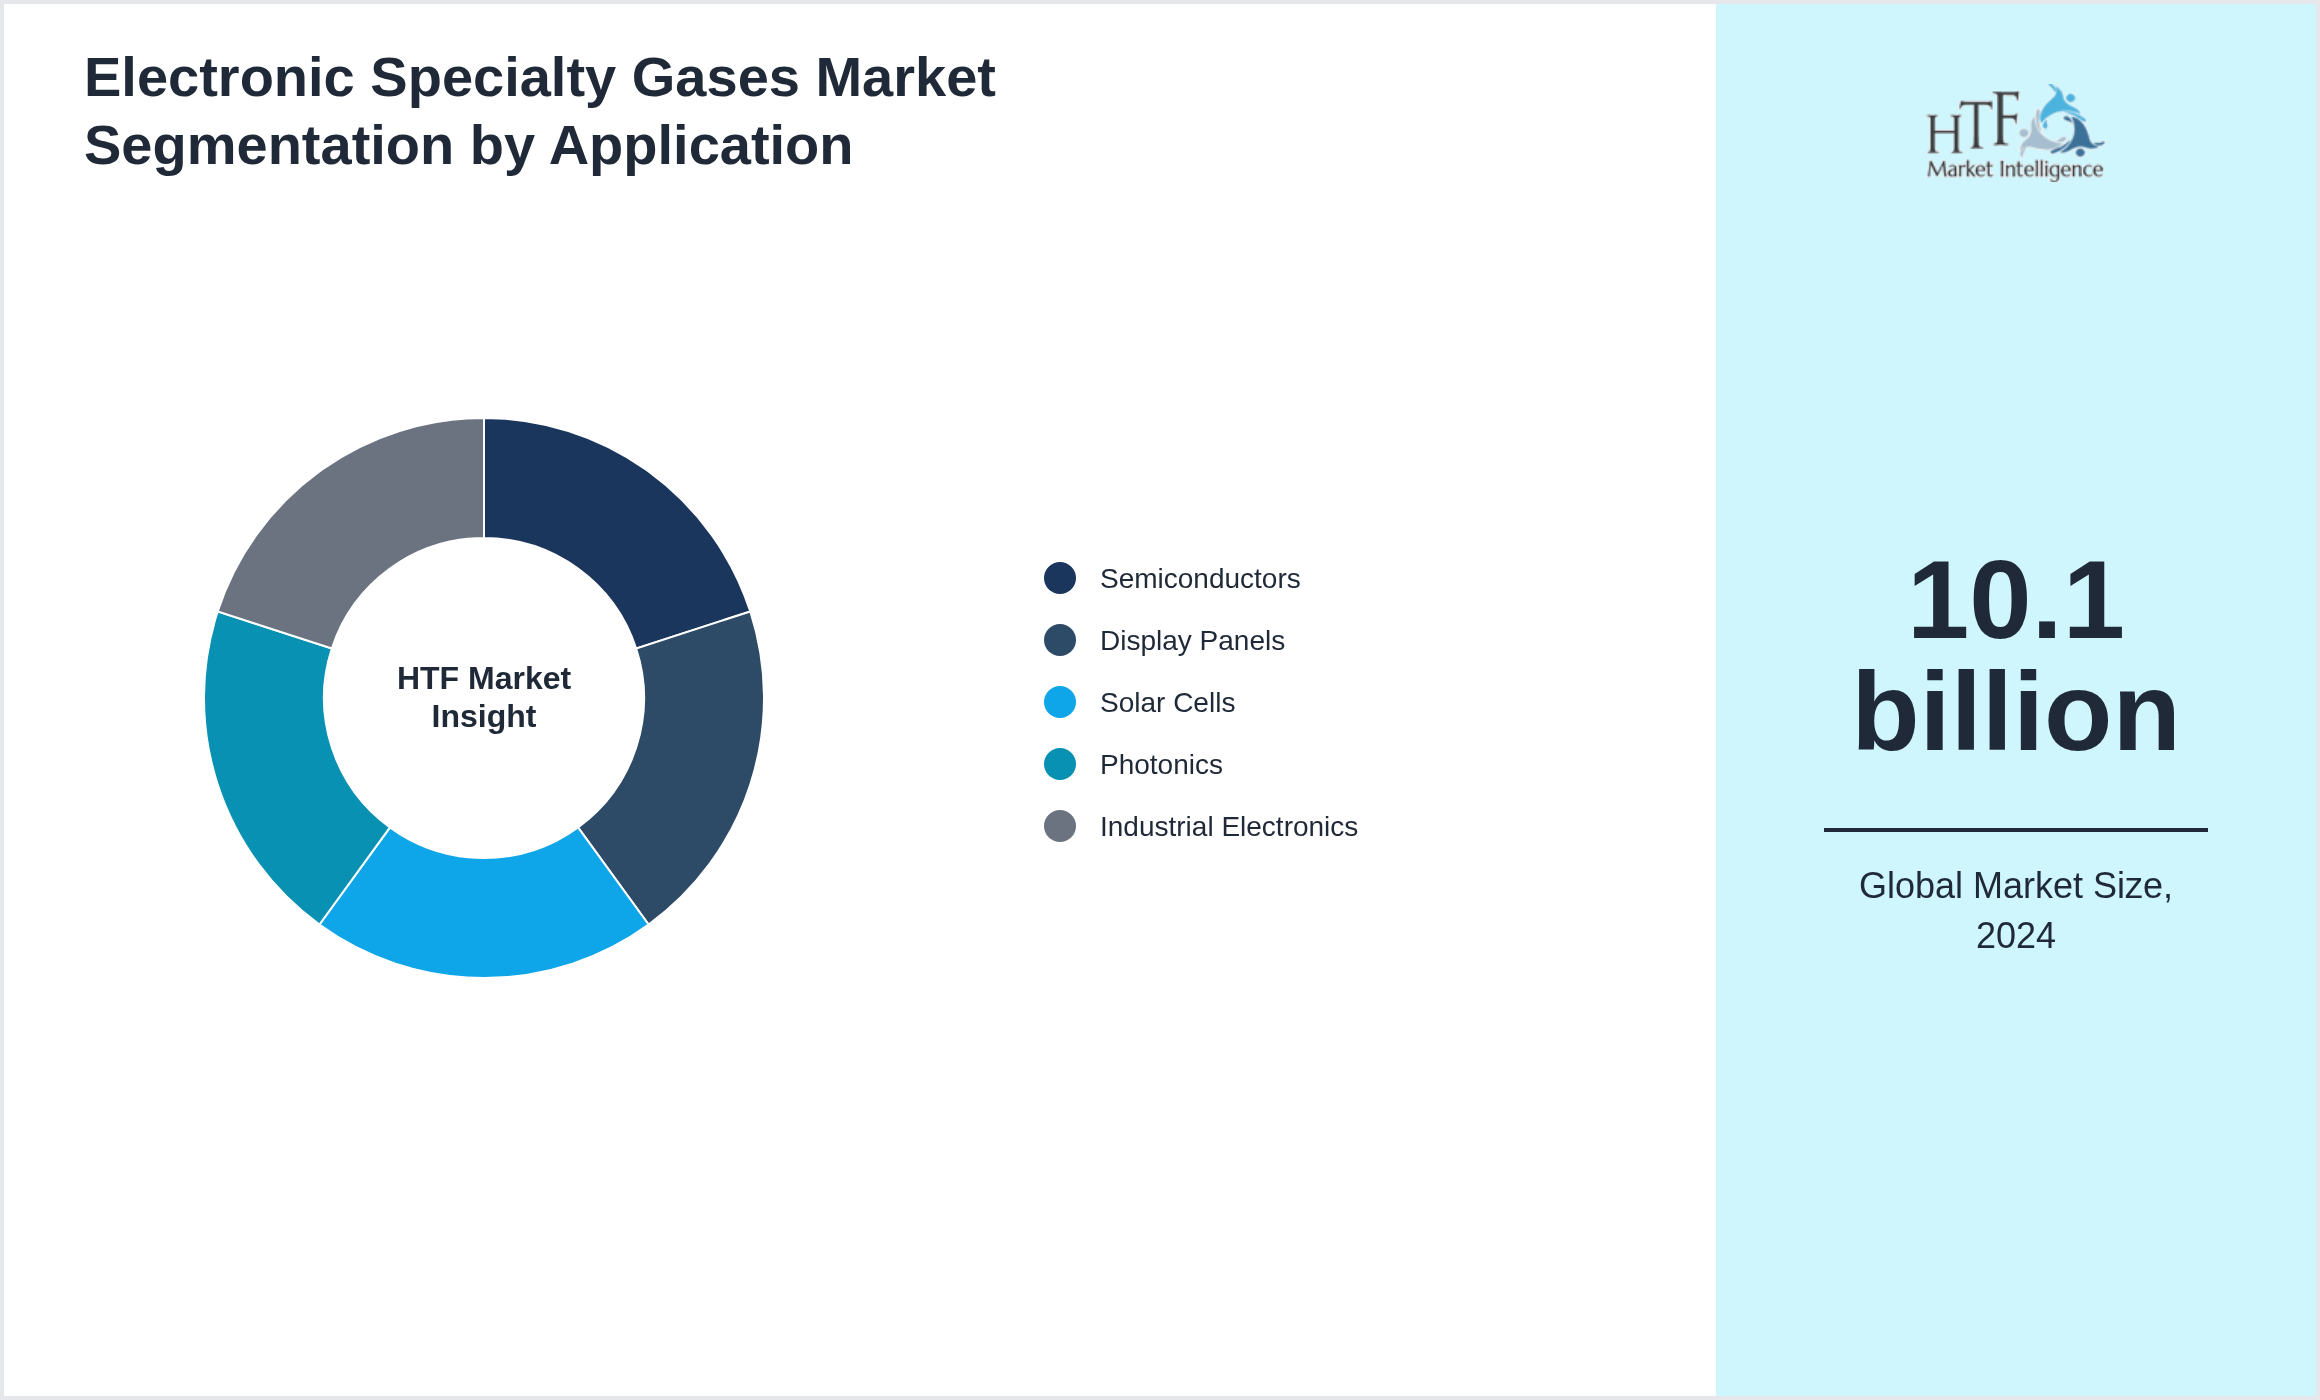
Market Segmentation
Segmentation by Type
- • High-Purity Gases
- • Specialty Process Gases
- • Electronic Grade Nitrogen
- • Specialty Etching Gases
- • Carrier Gases
Segmentation by Application
- • Semiconductors
- • Display Panels
- • Solar Cells
- • Photonics
- • Industrial Electronics
Regulatory Overview
The chemical industry is based on a regulatory framework that makes sure the industry does not harm the people, or the environment, or breach international standards. These regulations run from production to handling, storage, and disposal. The key legislations generally include the EU's REACH system and the US TSCA, which have also put stringent testing, reporting, and labeling requirements for chemical substances. Compliance with the above legislation requires that companies implement good safety management systems, conduct periodic audits, and monitor environmental performance continually. Apart from that, industry players also have to be abreast of changing legislation and newly emerging global standards on hazardous substances, waste management, and sustainability undertakings. Non-compliance can lead to substantial penalties, reputational damage, and operational discontinuations, which make adherence a key business issue.
Market Growth Drivers:
The Electronic Specialty Gases Market is experiencing significant growth due to various factors.
- • Increasing Semiconductor Manufacturing
- • Rising Demand For Display Technologies
- • Growth Of Solar Energy Applications
- • Technological Advancements In Electronics
- • Stringent Quality Requirements Drive Market Growth.
Influencing Trend:
The Electronic Specialty Gases Market is growing rapidly due to various factors.
- • Development Of Ultra-Pure Gas Delivery Systems
- • Focus On Sustainable Gases
- • Growth In Semiconductor Fabrication
- • Expansion Of Advanced Display Technologies
- • Integration With IoT Manufacturing Are Trends.
Opportunities:
The Electronic Specialty Gases has several opportunities, particularly in developing countries where industrialization is growing.
- • Expansion In Asia-Pacific Semiconductor Industry
- • Development Of Environmentally Friendly Specialty Gases
- • Partnerships With Electronics Manufacturers
- • Investment In Gas Purification Technologies
- • Growth In OLED And LED Applications Present Opportunities.
Challenges:
The market for fluid power systems faces several obstacles despite its promising growth possibilities.
- • High Purity Requirements
- • Supply Chain Complexity
- • Environmental Compliance Issues
- • High Costs Of Specialty Gases
- • Storage And Handling Challenges Are Key Challenges.
Report Infographics:
Report Features
|
Details
|
Base Year
|
2024
|
Based Year Market Size
|
10.1 billion
|
Historical Period
|
2020
|
CAGR (2024 to 2033)
|
10.50%
|
Forecast Period
|
2033
|
Forecasted Period Market Size (2033)
|
20.6 billion
|
Scope of the Report
|
High-Purity Gases, Specialty Process Gases, Electronic Grade Nitrogen, Specialty Etching Gases, Carrier Gases, Semiconductors, Display Panels, Solar Cells, Photonics, Industrial Electronics
|
Regions Covered
|
North America, Europe, Asia Pacific, Latin America, and MEA
|
Companies Covered
|
Linde (Germany), Air Liquide (France), Praxair (US), Matheson (US), Air Products (US), Taiyo Nippon Sanso (Japan), Iwatani (Japan), Messer Group (Germany), Nippon Gases (Japan), Showa Denko (Japan), SOL Group (US), SAPREF (South Africa), BOC Gases (Australia), Koura (US), Union Gas (Canada)
|
Customization Scope
|
15% Free Customization (For EG)
|
Delivery Format
|
PDF and Excel through Email
|
Report Coverage
The study on the Electronic Specialty Gases market provides a thorough examination of the sector. Important company profiles, new product releases, significant mergers, acquisitions, and collaborations, as well as the incidence of osteoarthritis in important nations, are also highlighted in the research.
Electronic Specialty Gases - Table of Contents
Chapter 1: Market Preface
Chapter 2: Strategic Overview
Chapter 3: Global Electronic Specialty Gases Market Business Environment & Changing Dynamics
Chapter 4: Global Electronic Specialty Gases Industry Factors Assessment
Chapter 5: Electronic Specialty Gases : Competition Benchmarking & Performance Evaluation
Chapter 6: Global Electronic Specialty Gases Market: Company Profiles
Chapter 7: Global Electronic Specialty Gases by Type & Application (2020-2033)
Chapter 8: North America Electronic Specialty Gases Market Breakdown by Country, Type & Application
Chapter 9: Europe Electronic Specialty Gases Market Breakdown by Country, Type & Application
Chapter 10: Asia Pacific Electronic Specialty Gases Market Breakdown by Country, Type & Application
Chapter 11: Latin America Electronic Specialty Gases Market Breakdown by Country, Type & Application
Chapter 12: Middle East & Africa Electronic Specialty Gases Market Breakdown by Country, Type & Application
Chapter 13: Research Finding and Conclusion
Frequently Asked Questions (FAQ):
The Compact Track Loaders market is projected to grow at a CAGR of 6.8% from 2025 to 2030, driven by increasing demand in construction and agricultural sectors.
North America currently leads the market with approximately 45% market share, followed by Europe at 28% and Asia-Pacific at 22%. The remaining regions account for 5% of the global market.
Key growth drivers include increasing construction activities, rising demand for versatile equipment in agriculture, technological advancements in track loader design, and growing preference for compact equipment in urban construction projects.