+15075562445 (US)
sales@htfmarketintelligence.com

Sustainable Plant Design Market Research Report

Published: Oct 24, 2025
ID: 4390701
131 Pages
Sustainable Plant
Design

Sustainable Plant Design Market - Global Industry Size & Growth Analysis 2020-2033

Global Sustainable Plant Design Market is segmented by Application (Manufacturing, Energy, Chemicals, Construction, Water Treatment), Type (Digital Twin Design, Modular Plant Design, Smart 3D Layouts, Energy-Efficient Plant Design, Green Infrastructure Planning), and Geography (North America, LATAM, West Europe, Central & Eastern Europe, Northern Europe, Southern Europe, East Asia, Southeast Asia, South Asia, Central Asia, Oceania, MEA)

Report ID:
HTF4390701
Published:
CAGR:
9.50%
Base Year:
2024
Market Size (2024):
$8.4 billion
Forecast (2033):
$16.5 billion

Pricing

Industry Overview


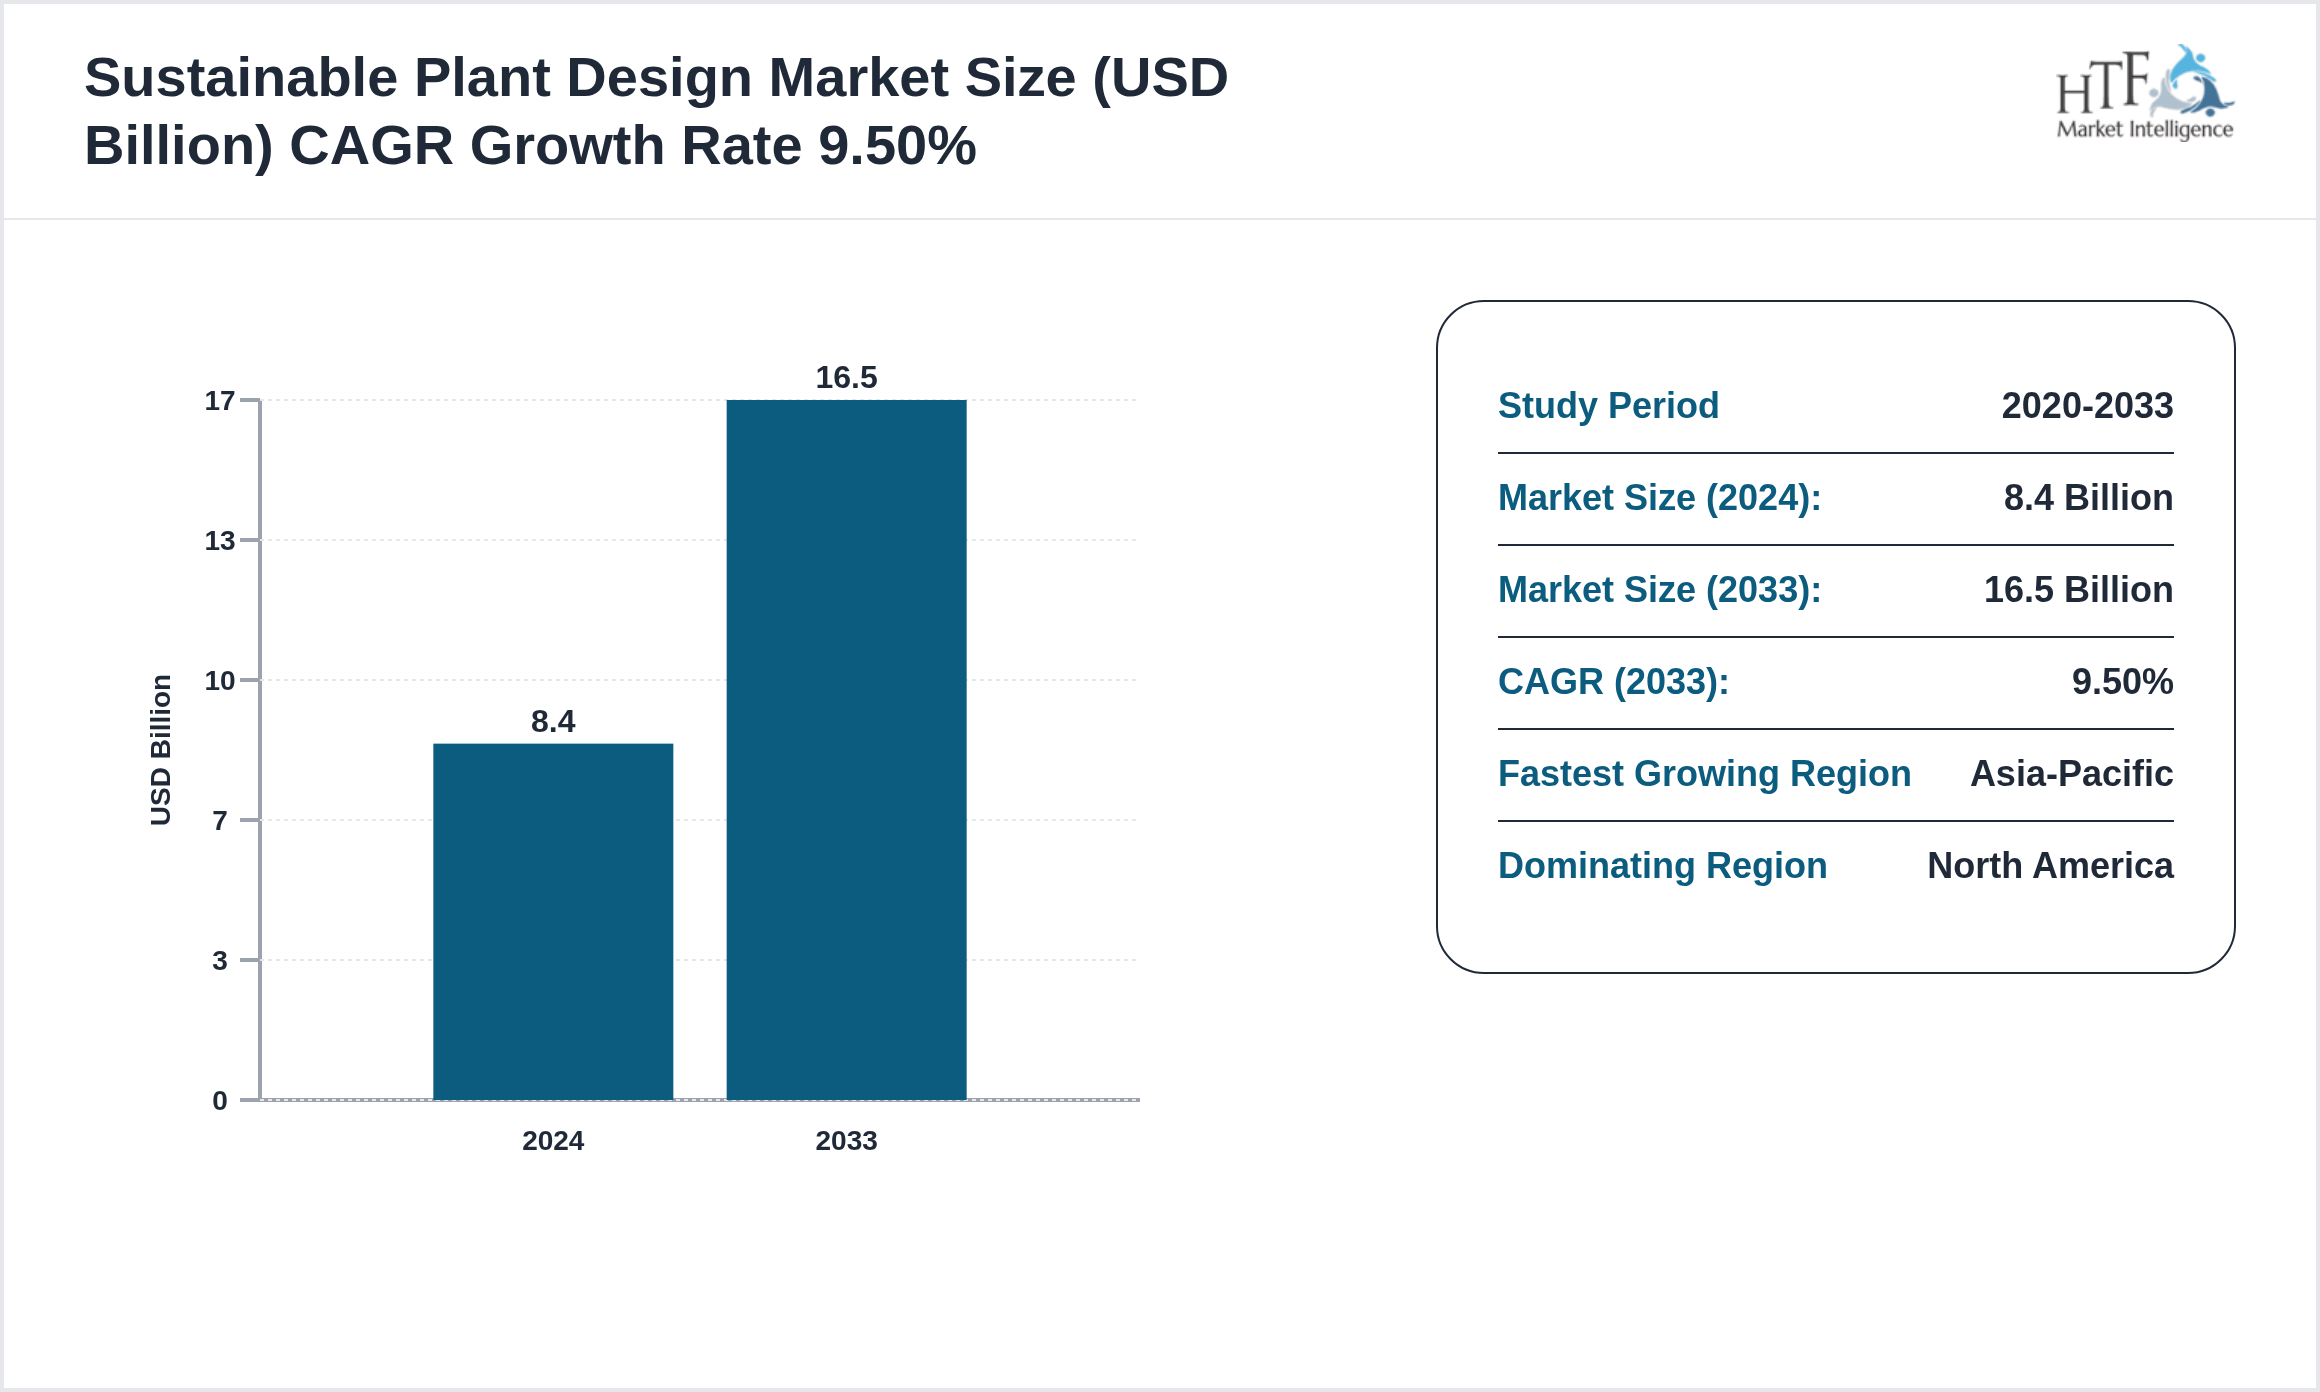
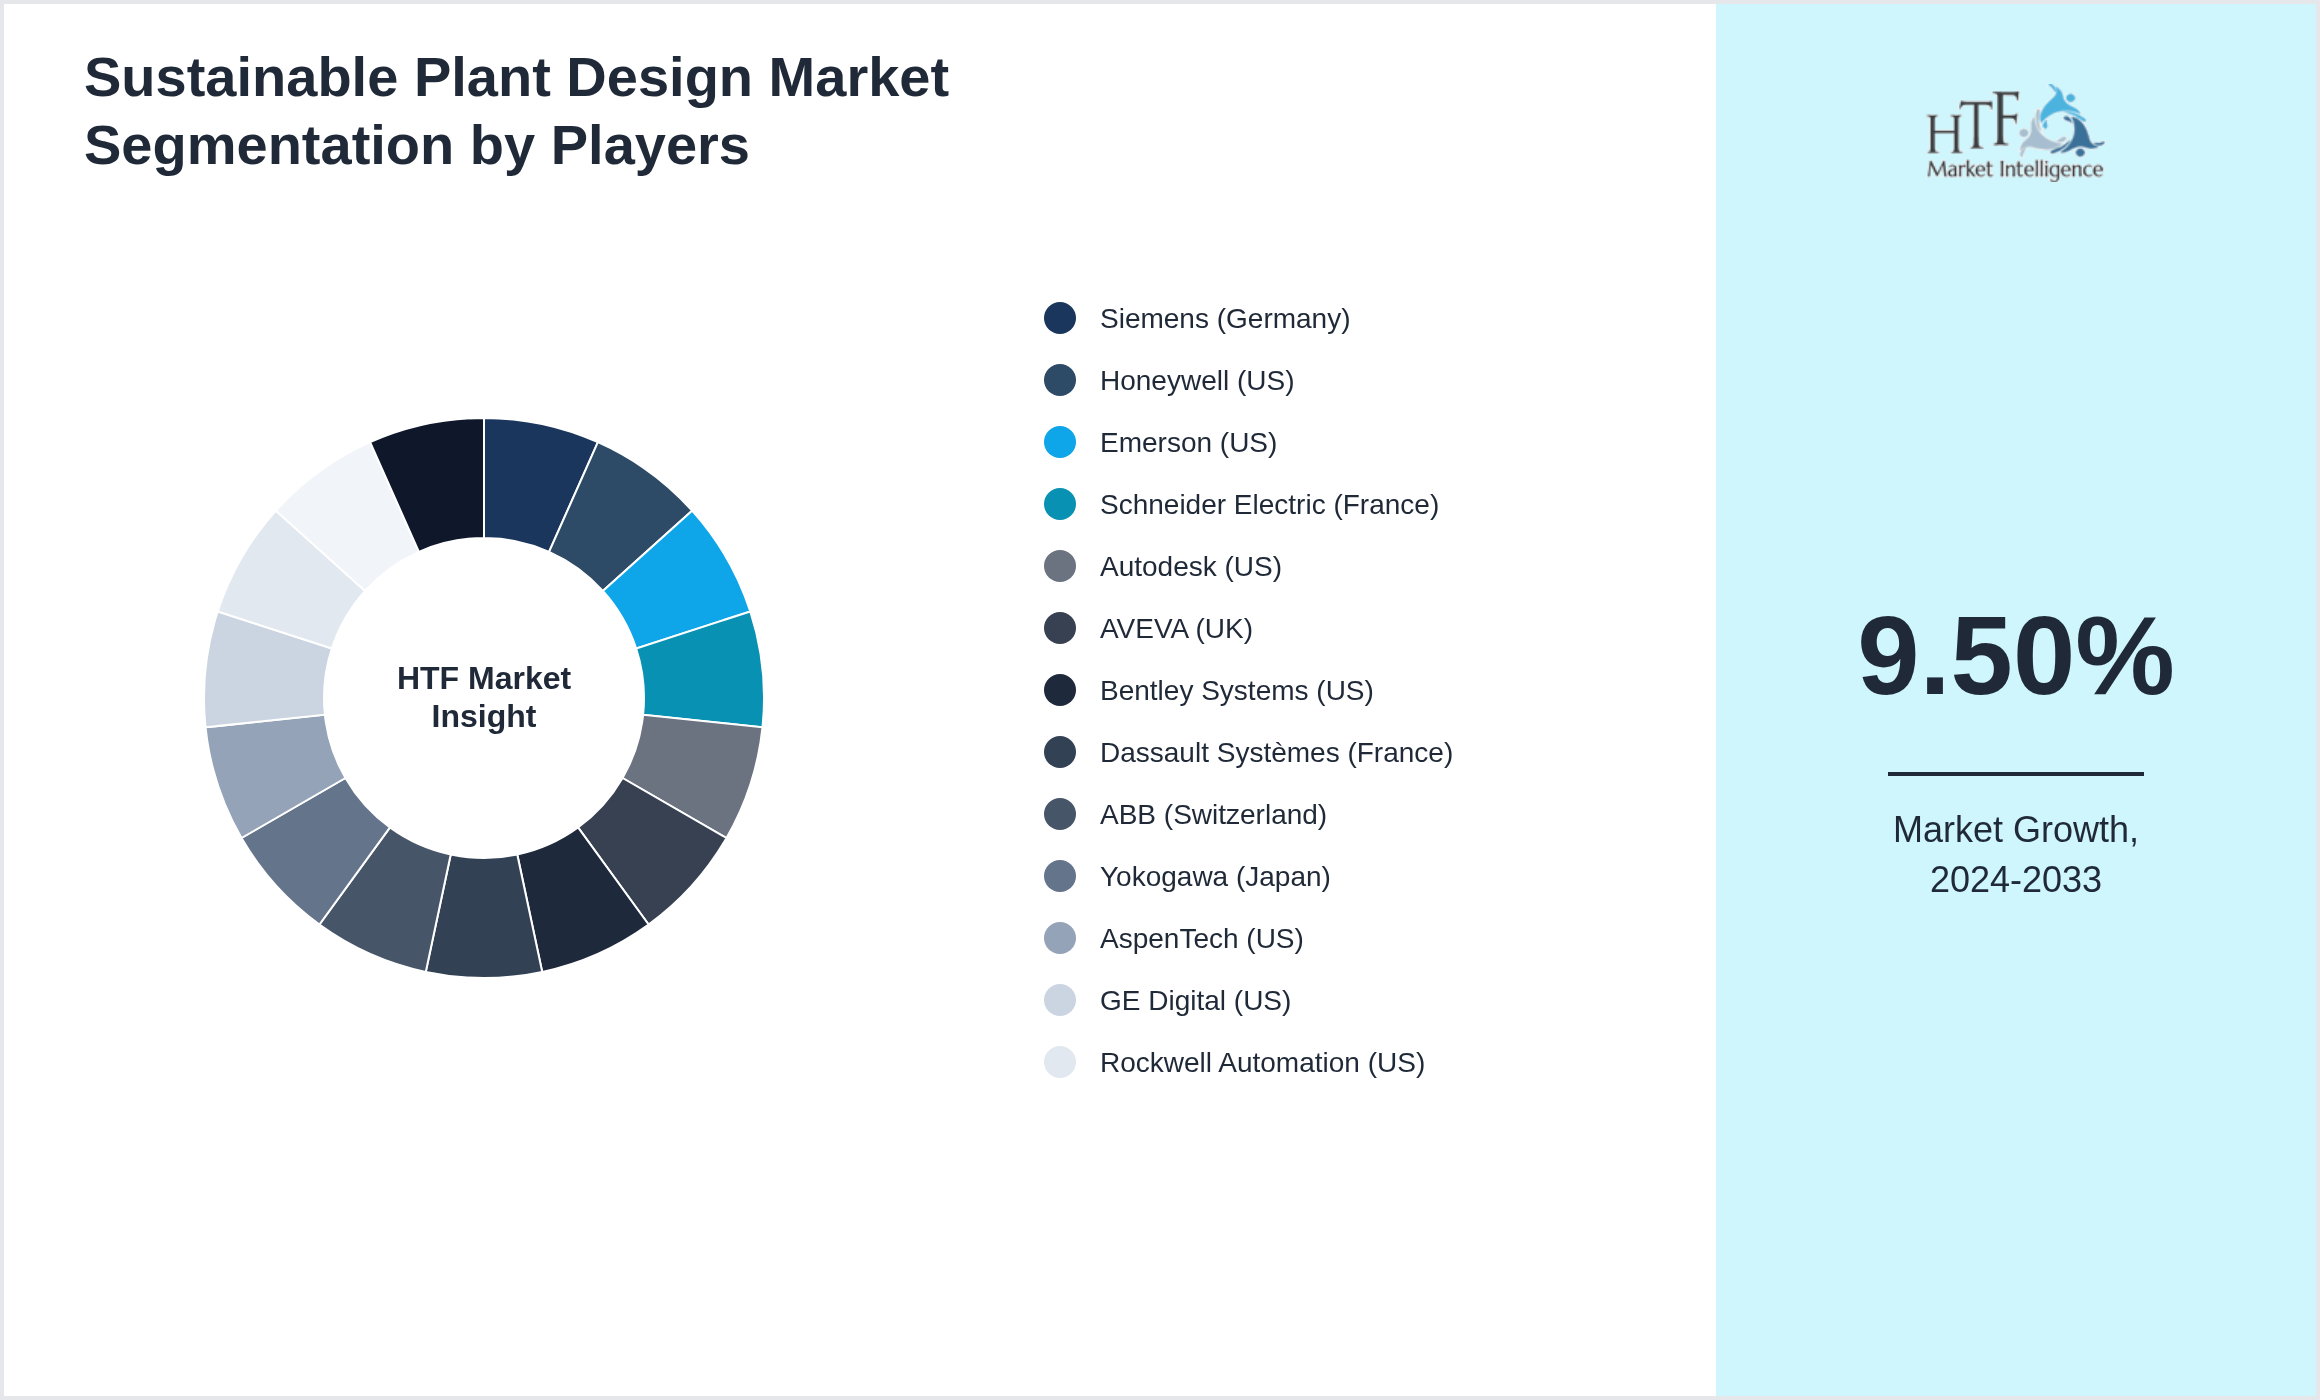
The Sustainable Plant Design is at 8.4 billion in 2024 and is expected to reach 16.5 billion by 2033. The Sustainable Plant Design is driven by factors such as increasing demand in end-use industries, technological advancements, research and development (R&D), economic growth, and increasing global trade. Siemens (Germany), Honeywell (US), Emerson (US), Schneider Electric (France), Autodesk (US), AVEVA (UK), Bentley Systems (US), Dassault Systèmes (France), ABB (Switzerland), Yokogawa (Japan), AspenTech (US), GE Digital (US), Rockwell Automation (US), Hexagon (Sweden), Trimble (US), and others are some of the key players in the market.
Sustainable Plant Design Market CAGR and Forecast Size


The sustainable plant design market emphasizes building and operating industrial facilities that minimize energy consumption and environmental impact. It leverages digital design tools, modular architecture, and renewable energy integration to enhance operational efficiency. The market is growing as industries transition to carbon-neutral and resource-efficient operations under global sustainability goals.


Key Players


Several key players in the Sustainable Plant Design market are strategically focusing on expanding their operations in developing regions to capture a larger market share, particularly as the year-on-year growth rate for the market stands at 8.20%. The companies featured in this profile were selected based on insights from primary experts, evaluating their market penetration, product offerings, and geographical reach. By targeting emerging markets, these companies aim to leverage new opportunities, enhance their competitive advantage, and drive revenue growth. This approach not only aligns with their overall business objectives but also positions them to respond effectively to the evolving demands of consumers in these regions.
  • Siemens (Germany)
  • Honeywell (US)
  • Emerson (US)
  • Schneider Electric (France)
  • Autodesk (US)
  • AVEVA (UK)
  • Bentley Systems (US)
  • Dassault Systèmes (France)
  • ABB (Switzerland)
  • Yokogawa (Japan)
  • AspenTech (US)
  • GE Digital (US)
  • Rockwell Automation (US)
  • Hexagon (Sweden)
  • Trimble (US)
Sustainable Plant Design Market Company analysis and in-depth profiling

Market Dynamics


Market Driver
  • Global Push For Decarbonization
  • Demand For Smart Manufacturing
  • Integration Of Green Infrastructure
  • Technological Advancements
  • Government Incentives
Market Trends
  • Adoption Of Digital Twins
  • Expansion Of Modular Construction
  • Focus On Circular Economy
  • Integration With IoT Platforms
  • Growth Of Sustainable Infrastructure
Opportunity
  • High Implementation Costs
  • Lack Of Skilled Designers
  • Legacy Infrastructure Limitations
  • Resistance To Change
  • Complexity In Integration
Challenges
  • Expansion In Smart Industrial Parks
  • Growth In AI-Based Design Tools
  • Partnerships For Green Infrastructure
  • Rising Government Funding
  • Development Of Modular Smart Plants

Key Highlights

  • The Sustainable Plant Design is growing at a 9.50% during the forecasted period of 2020 to 2033
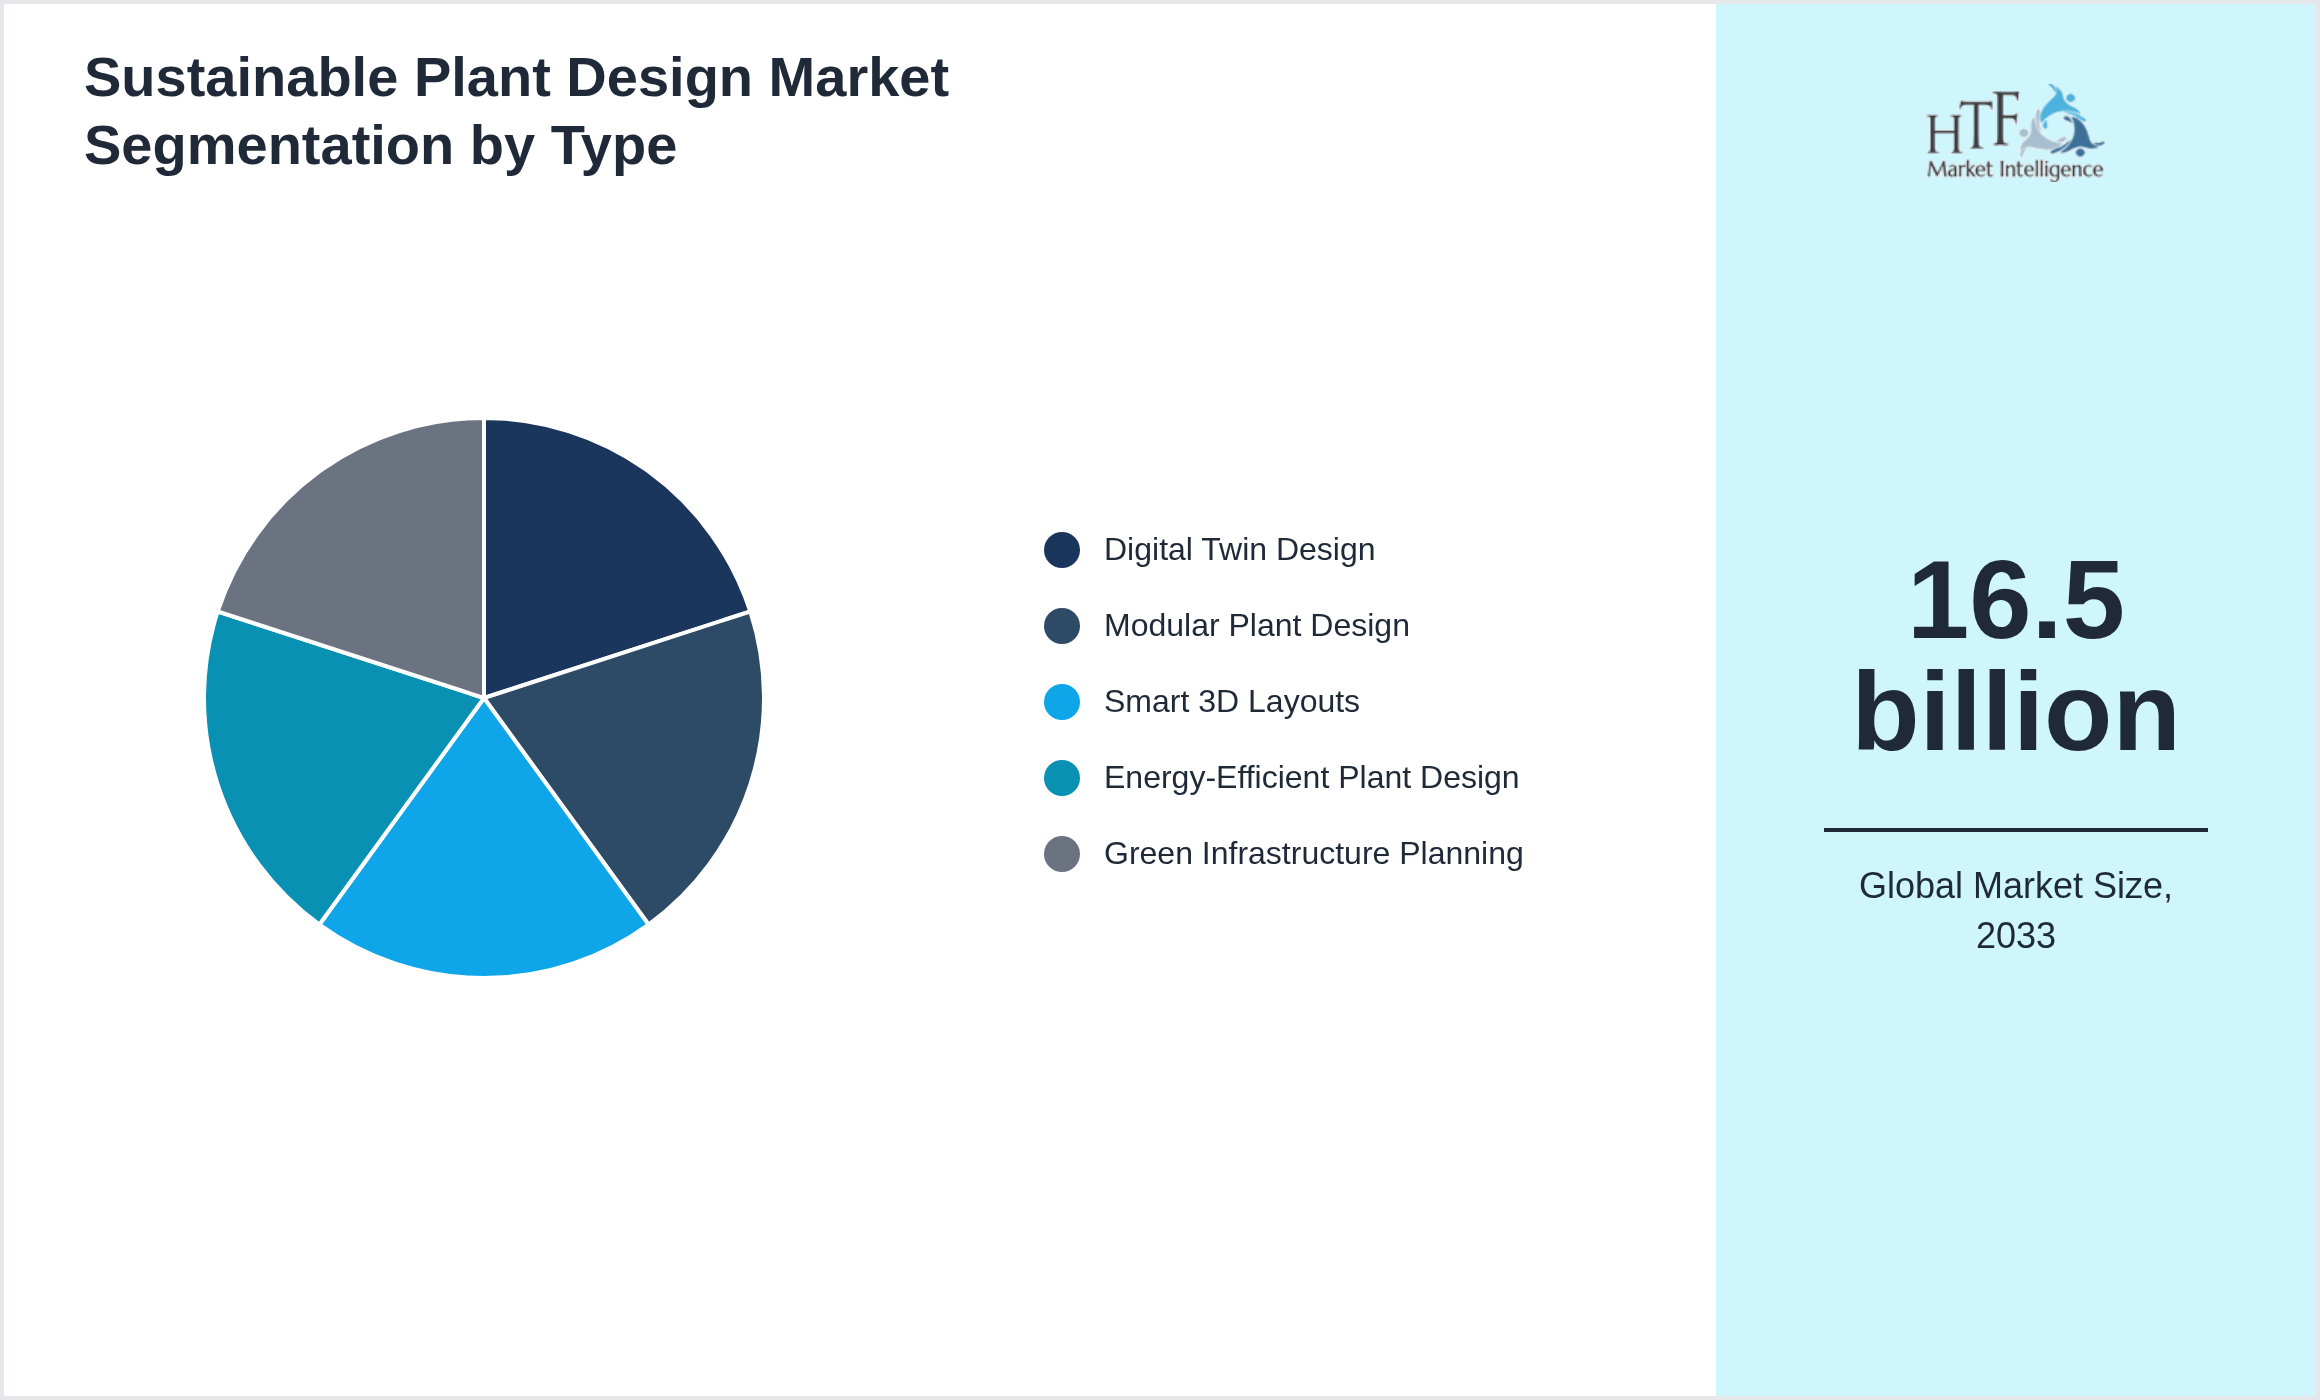
  • Based on type, the market is bifurcated into Digital Twin Design, Modular Plant Design, Smart 3D Layouts, Energy-Efficient Plant Design, Green Infrastructure Planning
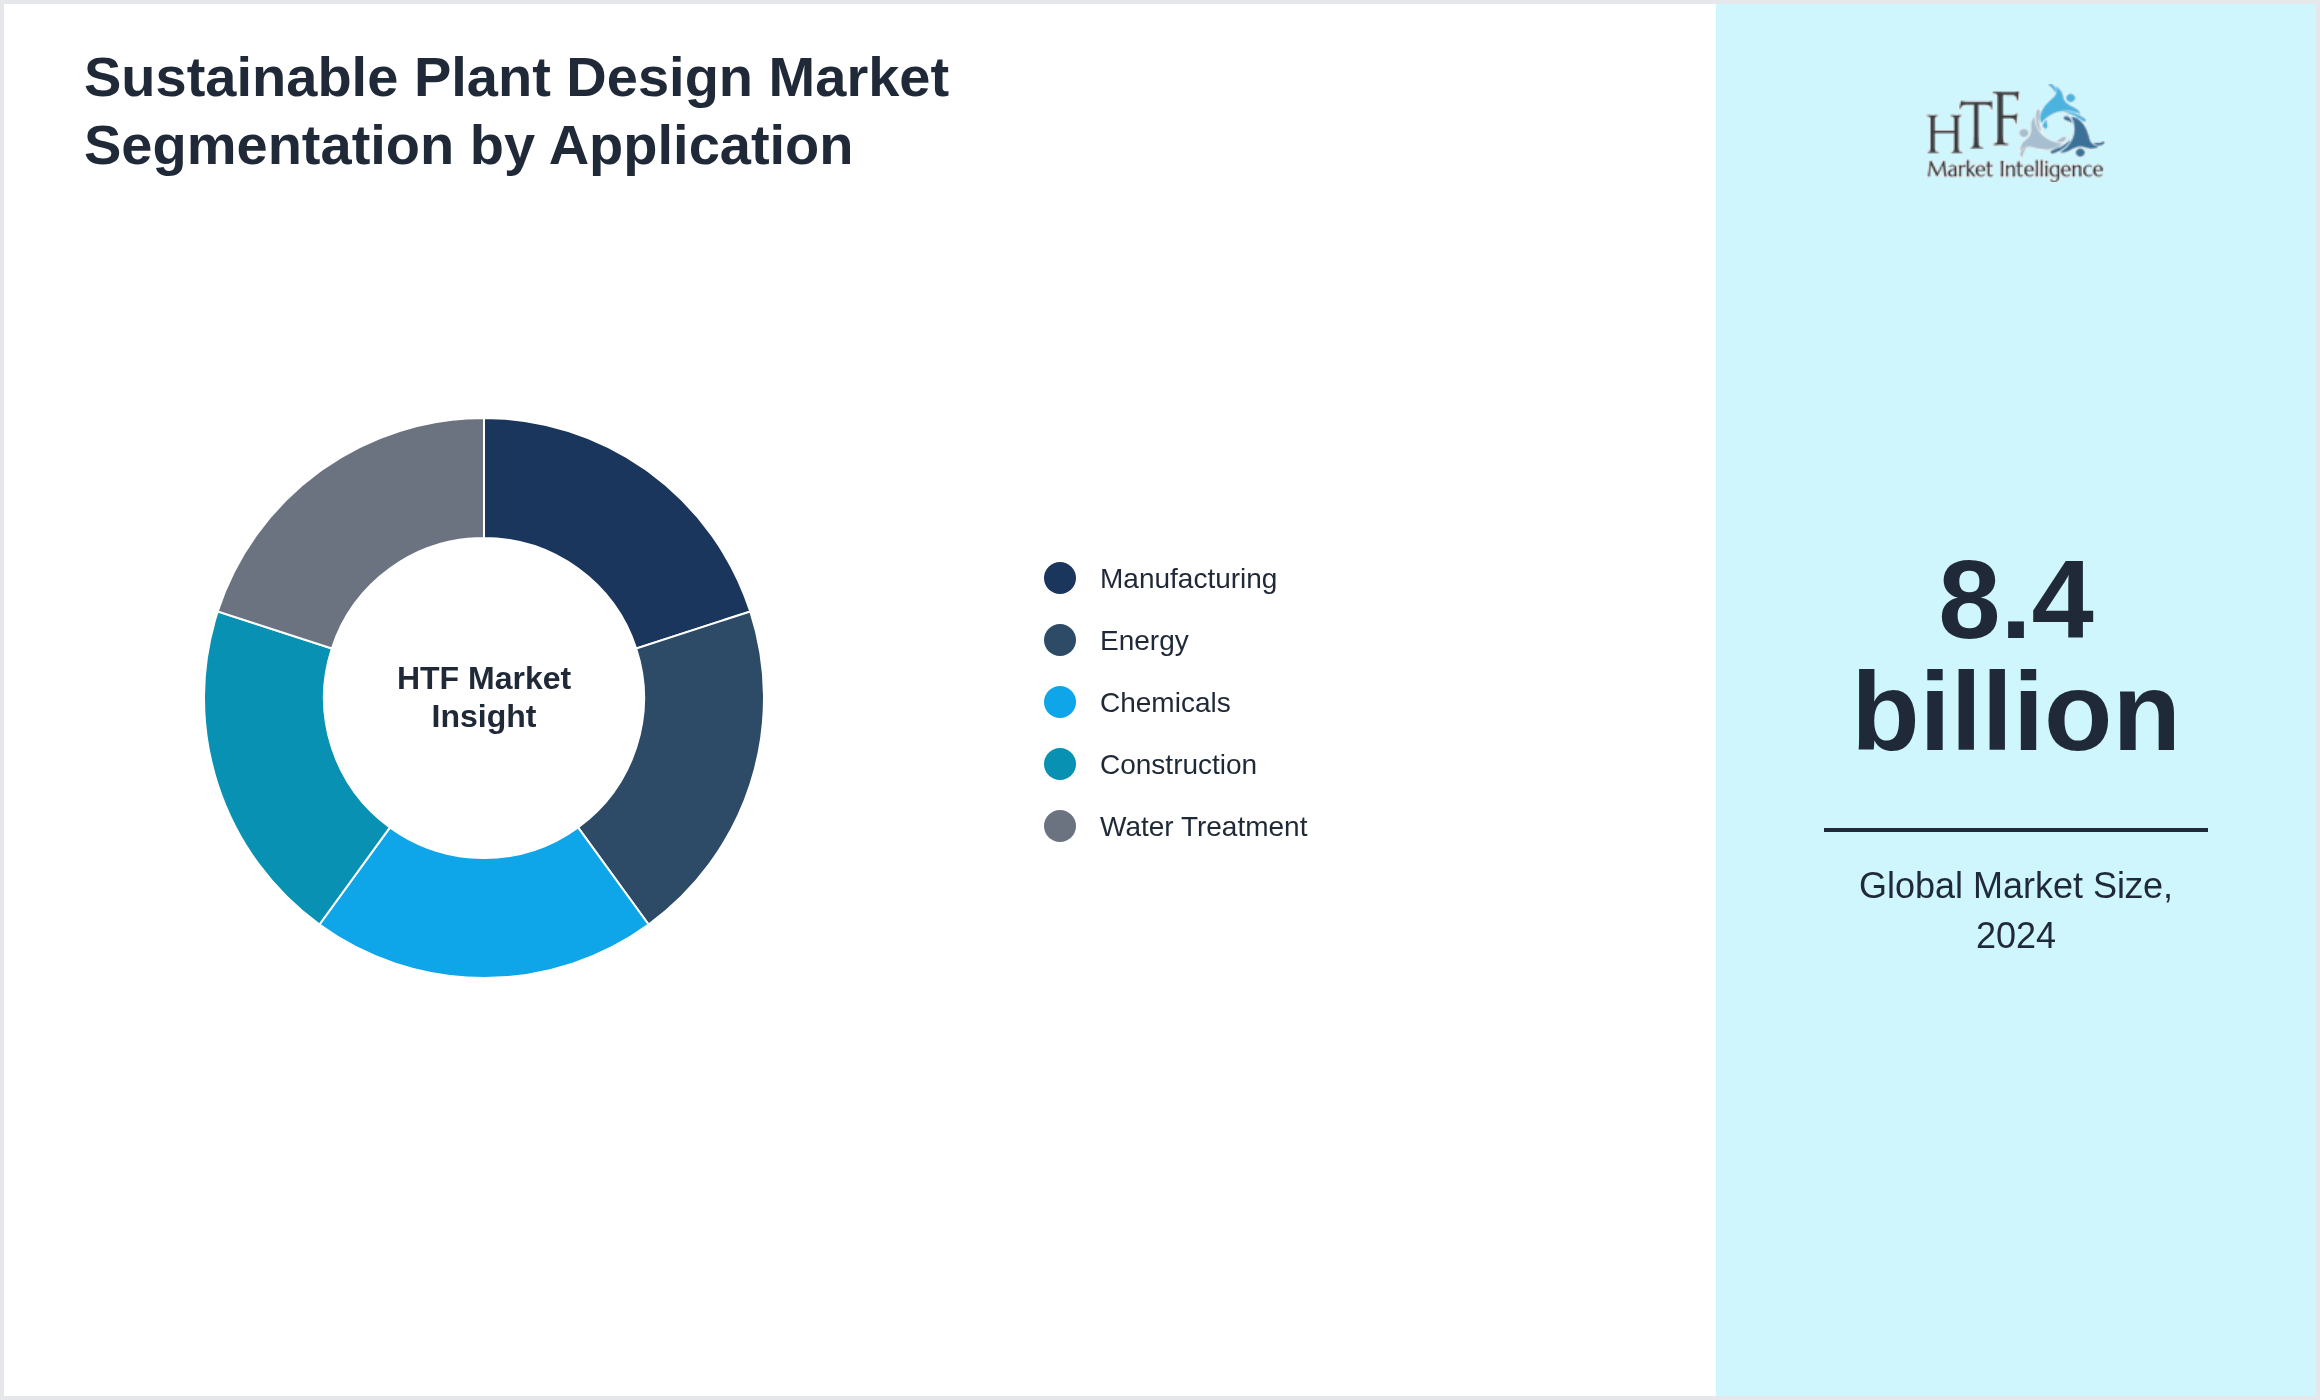
  • Based on application, the market is segmented into Manufacturing, Energy, Chemicals, Construction, Water Treatment
  • Global Import Export in terms of K Tons, K Units, and Metric Tons will be provided if Applicable based on industry best practice

Market Segmentation Overview

  • Type Segmentation: categorizes products by their specific variants, helping businesses identify demand drivers and innovate effectively.
  • Application Segmentation: Divides the market based on product usage across industries, enabling targeted marketing and growth identification.
  • Geographic Segmentation: Segments the market by location, allowing for tailored strategies based on regional preferences and economic factors.
  • Customer Segmentation: Focuses on demographics like age, gender, and income, enabling personalized marketing and improved customer targeting.
  • Distribution Channel Segmentation: categorizes by how products reach customers, optimizing supply chain and sales strategies.

Market Segmentation


Segmentation by Type

  • Digital Twin Design
  • Modular Plant Design
  • Smart 3D Layouts
  • Energy-Efficient Plant Design
  • Green Infrastructure Planning
Sustainable Plant Design Market penetration and growth by Digital Twin Design, Modular Plant Design, Smart 3D Layouts, Energy-Efficient Plant Design, Green Infrastructure Planning

Segmentation by Application

 
  • Manufacturing
  • Energy
  • Chemicals
  • Construction
  • Water Treatment
Sustainable Plant Design Market value by Manufacturing, Energy, Chemicals, Construction, Water Treatment

This report also splits the market by region:
  • North America
  • LATAM
  • West Europe
  • Central & Eastern Europe
  • Northern Europe
  • Southern Europe
  • East Asia
  • Southeast Asia
  • South Asia
  • Central Asia
  • Oceania
  • MEA
Asia-Pacific
North America
Fastest Growing Region
Dominating Region


Market Estimation Process

Primary & Secondary Approach


The Sustainable Plant Design is analyzed by both primary and secondary research sources. There are numerous methodologies available to navigate and utilize these resources effectively:
Surveys and Questionnaires: Getting feedback from healthcare professionals, patients, or any other stakeholders on a particular topic. It is a great method to collect quantitative data on behaviors, preferences, and/or experiences.
One on Ones: Interviews with key stakeholders, including physicians, nurses, and administrators can yield rich qualitative data. The interviews can be divided into structured, semi-structured, or unstructured.


Focus Groups: Pull together small numbers of people who share a common characteristic, trait, or behavior to discuss particular topics. Focus Groups: This offers qualitative data and points of view that are often overlooked, such as attitudes, perceptions, or other statements relating to a specific platform.


Observational Studies: Understanding healthcare practices and patient interactions in the way we do it can say a lot more than what people formally report doing.
Field Studies: This method allows researchers to collect data firsthand from healthcare settings, including hospitals, clinics, and even home. It is a way to touch and feel the context that drives service delivery in healthcare.
Secondary Research in Sustainable Plant Design
Secondary research is a kind of revising, restructuring, and rethinking what has already been collected by primary sources. Such research is beneficial as long as it comes at a low cost and gives an overarching view of the market. Some of the important methods include:
Literature Review: To go through the research papers, articles, and studies published in medical journals, industry reports, and academic publications. This is crucial for understanding the study landscape and identifying knowledge deficits.
Reports From the Industry: It aims in examining reports published by Market Research firms, Healthcare Associations, and Government bodies. This report can also be used by all stakeholders including service providers and delivery chains across the world to identify market opportunities in an undetermined depth.


Public Health Records: Data collected by governments and public health authorities in different countries of the world from organizations with global reach like CDC, WHO, or national departments. These are important because they provide us with epidemiological data and numbers.
Company Reports: Read the annual reports, financial statements, and press releases of healthcare companies. It includes company performance reports, market strategies, and competitive positioning for this domain.
Online Databases: You understand the access to databases like PubMed, MEDLINE, and even Google Scholar for scientific articles and study materials. Some of these databases are treasure troves for peer-reviewed data.
Media Sources: Analyzing news articles, press releases, and media coverage related to the healthcare industry. This helps in staying updated on recent developments and emerging trends.
A blended approach of primary and secondary research methods allows researchers to collect well-rounded, solid data that informs the best decisions and strategies.

Research Methodology


At HTF Market Intelligence, we pride ourselves on delivering comprehensive market research that combines both secondary and primary methodologies. Our secondary research involves rigorous analysis of existing data sources, such as industry reports, market databases, and competitive landscapes, to provide a robust foundation of market knowledge. This is complemented by our primary research services, where we gather firsthand data through surveys, interviews, and focus groups tailored specifically to your business needs. By integrating these approaches, we offer a thorough understanding of market trends, consumer behavior, and competitive dynamics, enabling you to make well-informed strategic decisions. We would welcome the opportunity to discuss how our research expertise can support your business objectives.

Report Infographics:

Report Features Details
Base Year 2024
Based Year Market Size (2024) 8.4 billion
Historical Period Market Size (2020) USD Million ZZ
CAGR (2024 to 2033) 9.50%
Forecast Period 2025 to 2033
Forecasted Period Market Size (2033) 16.5 billion
Scope of the Report Digital Twin Design, Modular Plant Design, Smart 3D Layouts, Energy-Efficient Plant Design, Green Infrastructure Planning, Manufacturing, Energy, Chemicals, Construction, Water Treatment
Regions Covered North America, LATAM, West Europe, Central & Eastern Europe, Northern Europe, Southern Europe, East Asia, Southeast Asia, South Asia, Central Asia, Oceania, MEA
Year on Year Growth 8.20%
Companies Covered Siemens (Germany), Honeywell (US), Emerson (US), Schneider Electric (France), Autodesk (US), AVEVA (UK), Bentley Systems (US), Dassault Systèmes (France), ABB (Switzerland), Yokogawa (Japan), AspenTech (US), GE Digital (US), Rockwell Automation (US), Hexagon (Sweden), Trimble (US)
Customization Scope 15% Free Customization (For EG)
Delivery Format PDF and Excel through Email

Sustainable Plant Design - Table of Contents

Chapter 1: Market Preface
1.1 Global Sustainable Plant Design Market Landscape
1.2 Scope of the Study
1.3 Relevant Findings & Stakeholder Advantages
Chapter 2: Strategic Overview
2.1 Global Sustainable Plant Design Market Outlook
2.2 Total Addressable Market versus Serviceable Market
2.3 Market Rivalry Projection
Chapter 3: Global Sustainable Plant Design Market Business Environment & Changing Dynamics
3.1 Growth Drivers
3.1.1 Global Push For Decarbonization
3.1.2 Demand For Smart Manufacturing
3.1.3 Integration Of Green Infrastructure
3.1.4 Technological Advancements
3.1.5 Government Incentives
3.2 Available Opportunities
3.2.1 High Implementation Costs
3.2.2 Lack Of Skilled Designers
3.2.3 Legacy Infrastructure Limitations
3.2.4 Resistance To Change
3.2.5 Complexity In Integration
3.3 Influencing Trends
3.3.1 Adoption Of Digital Twins
3.3.2 Expansion Of Modular Construction
3.3.3 Focus On Circular Economy
3.3.4 Integration With Io T Platforms
3.3.5 Growth Of Sustainable Infrastructure
3.4 Challenges
3.4.1 Expansion In Smart Industrial Parks
3.4.2 Growth In AI-Based Design Tools
3.4.3 Partnerships For Green Infrastructure
3.4.4 Rising Government Funding
3.4.5 Development Of Modular Smart Plants
3.5 Regional Dynamics
Chapter 4: Global Sustainable Plant Design Industry Factors Assessment
4.1 Current Scenario
4.2 PEST Analysis
4.3 Business Environment - PORTER 5-Forces Analysis
4.3.1 Supplier Leverage
4.3.2 Bargaining Power of Buyers
4.3.3 Threat of Substitutes
4.3.4 Threat from New Entrant
4.3.5 Market Competition Level
4.4 Roadmap of Sustainable Plant Design Market
4.5 Impact of Macro-Economic Factors
4.6 Market Entry Strategies
4.7 Political and Regulatory Landscape
4.8 Supply Chain Analysis
4.9 Impact of Tariff War
Chapter 5: Sustainable Plant Design : Competition Benchmarking & Performance Evaluation
5.1 Global Sustainable Plant Design Market Concentration Ratio
5.1.1 CR4
5.1.2 CR8 and HH Index
5.1.2 % Market Share - Top 3
5.1.3 Market Holding by Top 5
5.2 Market Position of Manufacturers by Sustainable Plant Design Revenue 2024
5.3 Global Sustainable Plant Design Sales Volume by Manufacturers (2024)
5.4 BCG Matrix
5.4 Market Entropy
5.5 Strategic Alliances and Partnerships
5.6 Merger & Acquisition Activities
5.7 Innovation and R&D Investment
5.8 Distribution Channel Analysis
5.9 Customer Loyalty Assessment
Chapter 6: Global Sustainable Plant Design Market: Company Profiles
6.1 Siemens (Germany)
6.1.1 Siemens (Germany) Company Overview
6.1.2 Siemens (Germany) Product/Service Portfolio & Specifications
6.1.3 Siemens (Germany) Key Financial Metrics
6.1.4 Siemens (Germany) SWOT Analysis
6.1.5 Siemens (Germany) Development Activities
6.2 Honeywell (US)
6.3 Emerson (US)
6.4 Schneider Electric (France)
6.5 Autodesk (US)
6.6 AVEVA (UK)
6.7 Bentley Systems (US)
6.8 Dassault Systèmes (France)
6.9 ABB (Switzerland)
6.10 Yokogawa (Japan)
6.11 Aspen Tech (US)
6.12 GE Digital (US)
6.13 Rockwell Automation (US)
6.14 Hexagon (Sweden)
6.15 Trimble (US)
Chapter 7: Global Sustainable Plant Design by Type & Application (2020-2033)
7.1 Global Sustainable Plant Design Market Revenue Analysis (USD Million) by Type (2020-2024)
7.1.1 Digital Twin Design
7.1.2 Modular Plant Design
7.1.3 Smart 3D Layouts
7.1.4 Energy-Efficient Plant Design
7.1.5 Green Infrastructure Planning
7.2 Global Sustainable Plant Design Market Revenue Analysis (USD Million) by Application (2020-2024)
7.2.1 Manufacturing
7.2.2 Energy
7.2.3 Chemicals
7.2.4 Construction
7.2.5 Water Treatment
7.3 Global Sustainable Plant Design Market Revenue Analysis (USD Million) by Type (2024-2033)
7.4 Global Sustainable Plant Design Market Revenue Analysis (USD Million) by Application (2024-2033)
Chapter 8: North America Sustainable Plant Design Market Breakdown by Country, Type & Application
8.1 North America Sustainable Plant Design Market by Country (USD Million) & Sales Volume (Units) [2020-2024]
8.1.1 United States
8.1.2 Canada
8.1.3 Mexico
8.2 North America Sustainable Plant Design Market by Type (USD Million) & Sales Volume (Units) [2020-2024]
8.2.1 Digital Twin Design
8.2.2 Modular Plant Design
8.2.3 Smart 3D Layouts
8.2.4 Energy-Efficient Plant Design
8.2.5 Green Infrastructure Planning
8.3 North America Sustainable Plant Design Market by Application (USD Million) & Sales Volume (Units) [2020-2024]
8.3.1 Manufacturing
8.3.2 Energy
8.3.3 Chemicals
8.3.4 Construction
8.3.5 Water Treatment
8.4 North America Sustainable Plant Design Market by Country (USD Million) & Sales Volume (Units) [2025-2033]
8.5 North America Sustainable Plant Design Market by Type (USD Million) & Sales Volume (Units) [2025-2033]
8.6 North America Sustainable Plant Design Market by Application (USD Million) & Sales Volume (Units) [2025-2033]
Chapter 9: Europe Sustainable Plant Design Market Breakdown by Country, Type & Application
9.1 Europe Sustainable Plant Design Market by Country (USD Million) & Sales Volume (Units) [2020-2024]
9.1.1 Germany
9.1.2 UK
9.1.3 France
9.1.4 Italy
9.1.5 Spain
9.1.6 Russia
9.1.7 Rest of Europe
9.2 Europe Sustainable Plant Design Market by Type (USD Million) & Sales Volume (Units) [2020-2024]
9.2.1 Digital Twin Design
9.2.2 Modular Plant Design
9.2.3 Smart 3D Layouts
9.2.4 Energy-Efficient Plant Design
9.2.5 Green Infrastructure Planning
9.3 Europe Sustainable Plant Design Market by Application (USD Million) & Sales Volume (Units) [2020-2024]
9.3.1 Manufacturing
9.3.2 Energy
9.3.3 Chemicals
9.3.4 Construction
9.3.5 Water Treatment
9.4 Europe Sustainable Plant Design Market by Country (USD Million) & Sales Volume (Units) [2025-2033]
9.5 Europe Sustainable Plant Design Market by Type (USD Million) & Sales Volume (Units) [2025-2033]
9.6 Europe Sustainable Plant Design Market by Application (USD Million) & Sales Volume (Units) [2025-2033]
Chapter 10: Asia Pacific Sustainable Plant Design Market Breakdown by Country, Type & Application
10.1 Asia Pacific Sustainable Plant Design Market by Country (USD Million) & Sales Volume (Units) [2020-2024]
10.1.1 China
10.1.2 Japan
10.1.3 India
10.1.4 South Korea
10.1.5 Australia
10.1.6 Southeast Asia
10.1.7 Rest of Asia Pacific
10.2 Asia Pacific Sustainable Plant Design Market by Type (USD Million) & Sales Volume (Units) [2020-2024]
10.2.1 Digital Twin Design
10.2.2 Modular Plant Design
10.2.3 Smart 3D Layouts
10.2.4 Energy-Efficient Plant Design
10.2.5 Green Infrastructure Planning
10.3 Asia Pacific Sustainable Plant Design Market by Application (USD Million) & Sales Volume (Units) [2020-2024]
10.3.1 Manufacturing
10.3.2 Energy
10.3.3 Chemicals
10.3.4 Construction
10.3.5 Water Treatment
10.4 Asia Pacific Sustainable Plant Design Market by Country (USD Million) & Sales Volume (Units) [2025-2033]
10.5 Asia Pacific Sustainable Plant Design Market by Type (USD Million) & Sales Volume (Units) [2025-2033]
10.6 Asia Pacific Sustainable Plant Design Market by Application (USD Million) & Sales Volume (Units) [2025-2033]
Chapter 11: Latin America Sustainable Plant Design Market Breakdown by Country, Type & Application
11.1 Latin America Sustainable Plant Design Market by Country (USD Million) & Sales Volume (Units) [2020-2024]
11.1.1 Brazil
11.1.2 Argentina
11.1.3 Chile
11.1.4 Rest of Latin America
11.2 Latin America Sustainable Plant Design Market by Type (USD Million) & Sales Volume (Units) [2020-2024]
11.2.1 Digital Twin Design
11.2.2 Modular Plant Design
11.2.3 Smart 3D Layouts
11.2.4 Energy-Efficient Plant Design
11.2.5 Green Infrastructure Planning
11.3 Latin America Sustainable Plant Design Market by Application (USD Million) & Sales Volume (Units) [2020-2024]
11.3.1 Manufacturing
11.3.2 Energy
11.3.3 Chemicals
11.3.4 Construction
11.3.5 Water Treatment
11.4 Latin America Sustainable Plant Design Market by Country (USD Million) & Sales Volume (Units) [2025-2033]
11.5 Latin America Sustainable Plant Design Market by Type (USD Million) & Sales Volume (Units) [2025-2033]
11.6 Latin America Sustainable Plant Design Market by Application (USD Million) & Sales Volume (Units) [2025-2033]
Chapter 12: Middle East & Africa Sustainable Plant Design Market Breakdown by Country, Type & Application
12.1 Middle East & Africa Sustainable Plant Design Market by Country (USD Million) & Sales Volume (Units) [2020-2024]
12.1.1 Saudi Arabia
12.1.2 UAE
12.1.3 South Africa
12.1.4 Egypt
12.1.5 Rest of Middle East & Africa
12.2 Middle East & Africa Sustainable Plant Design Market by Type (USD Million) & Sales Volume (Units) [2020-2024]
12.2.1 Digital Twin Design
12.2.2 Modular Plant Design
12.2.3 Smart 3D Layouts
12.2.4 Energy-Efficient Plant Design
12.2.5 Green Infrastructure Planning
12.3 Middle East & Africa Sustainable Plant Design Market by Application (USD Million) & Sales Volume (Units) [2020-2024]
12.3.1 Manufacturing
12.3.2 Energy
12.3.3 Chemicals
12.3.4 Construction
12.3.5 Water Treatment
12.4 Middle East & Africa Sustainable Plant Design Market by Country (USD Million) & Sales Volume (Units) [2025-2033]
12.5 Middle East & Africa Sustainable Plant Design Market by Type (USD Million) & Sales Volume (Units) [2025-2033]
12.6 Middle East & Africa Sustainable Plant Design Market by Application (USD Million) & Sales Volume (Units) [2025-2033]
Chapter 13: Research Finding and Conclusion
13.1 Research Finding
13.2 Conclusion
13.3 Analyst Recommendation

Frequently Asked Questions (FAQ):

The Compact Track Loaders market is expected to see value worth 5.3 Billion in 2025.

North America currently leads the market with approximately 45% market share, followed by Europe at 28% and Asia-Pacific at 22%. The remaining regions account for 5% of the global market.

Key growth drivers include increasing construction activities, rising demand for versatile equipment in agriculture, technological advancements in track loader design, and growing preference for compact equipment in urban construction projects.