
Smart Glasses for Visually Impaired Market Research Report
Global Smart Glasses for Visually Impaired Market Scope & Changing Dynamics 2024-2033
Global Smart Glasses for Visually Impaired Market is segmented by Application (Healthcare, Personal Assistance, Navigation, Education, Mobility Services), Type (Augmented Reality Glasses for Vision, Smart Glasses with Audio Assistance, Wearable Vision Aids, Eye-Tracking Glasses, Voice-Activated Smart Glasses), and Geography (North America, LATAM, West Europe, Central & Eastern Europe, Northern Europe, Southern Europe, East Asia, Southeast Asia, South Asia, Central Asia, Oceania, MEA)
Pricing
INDUSTRY OVERVIEW
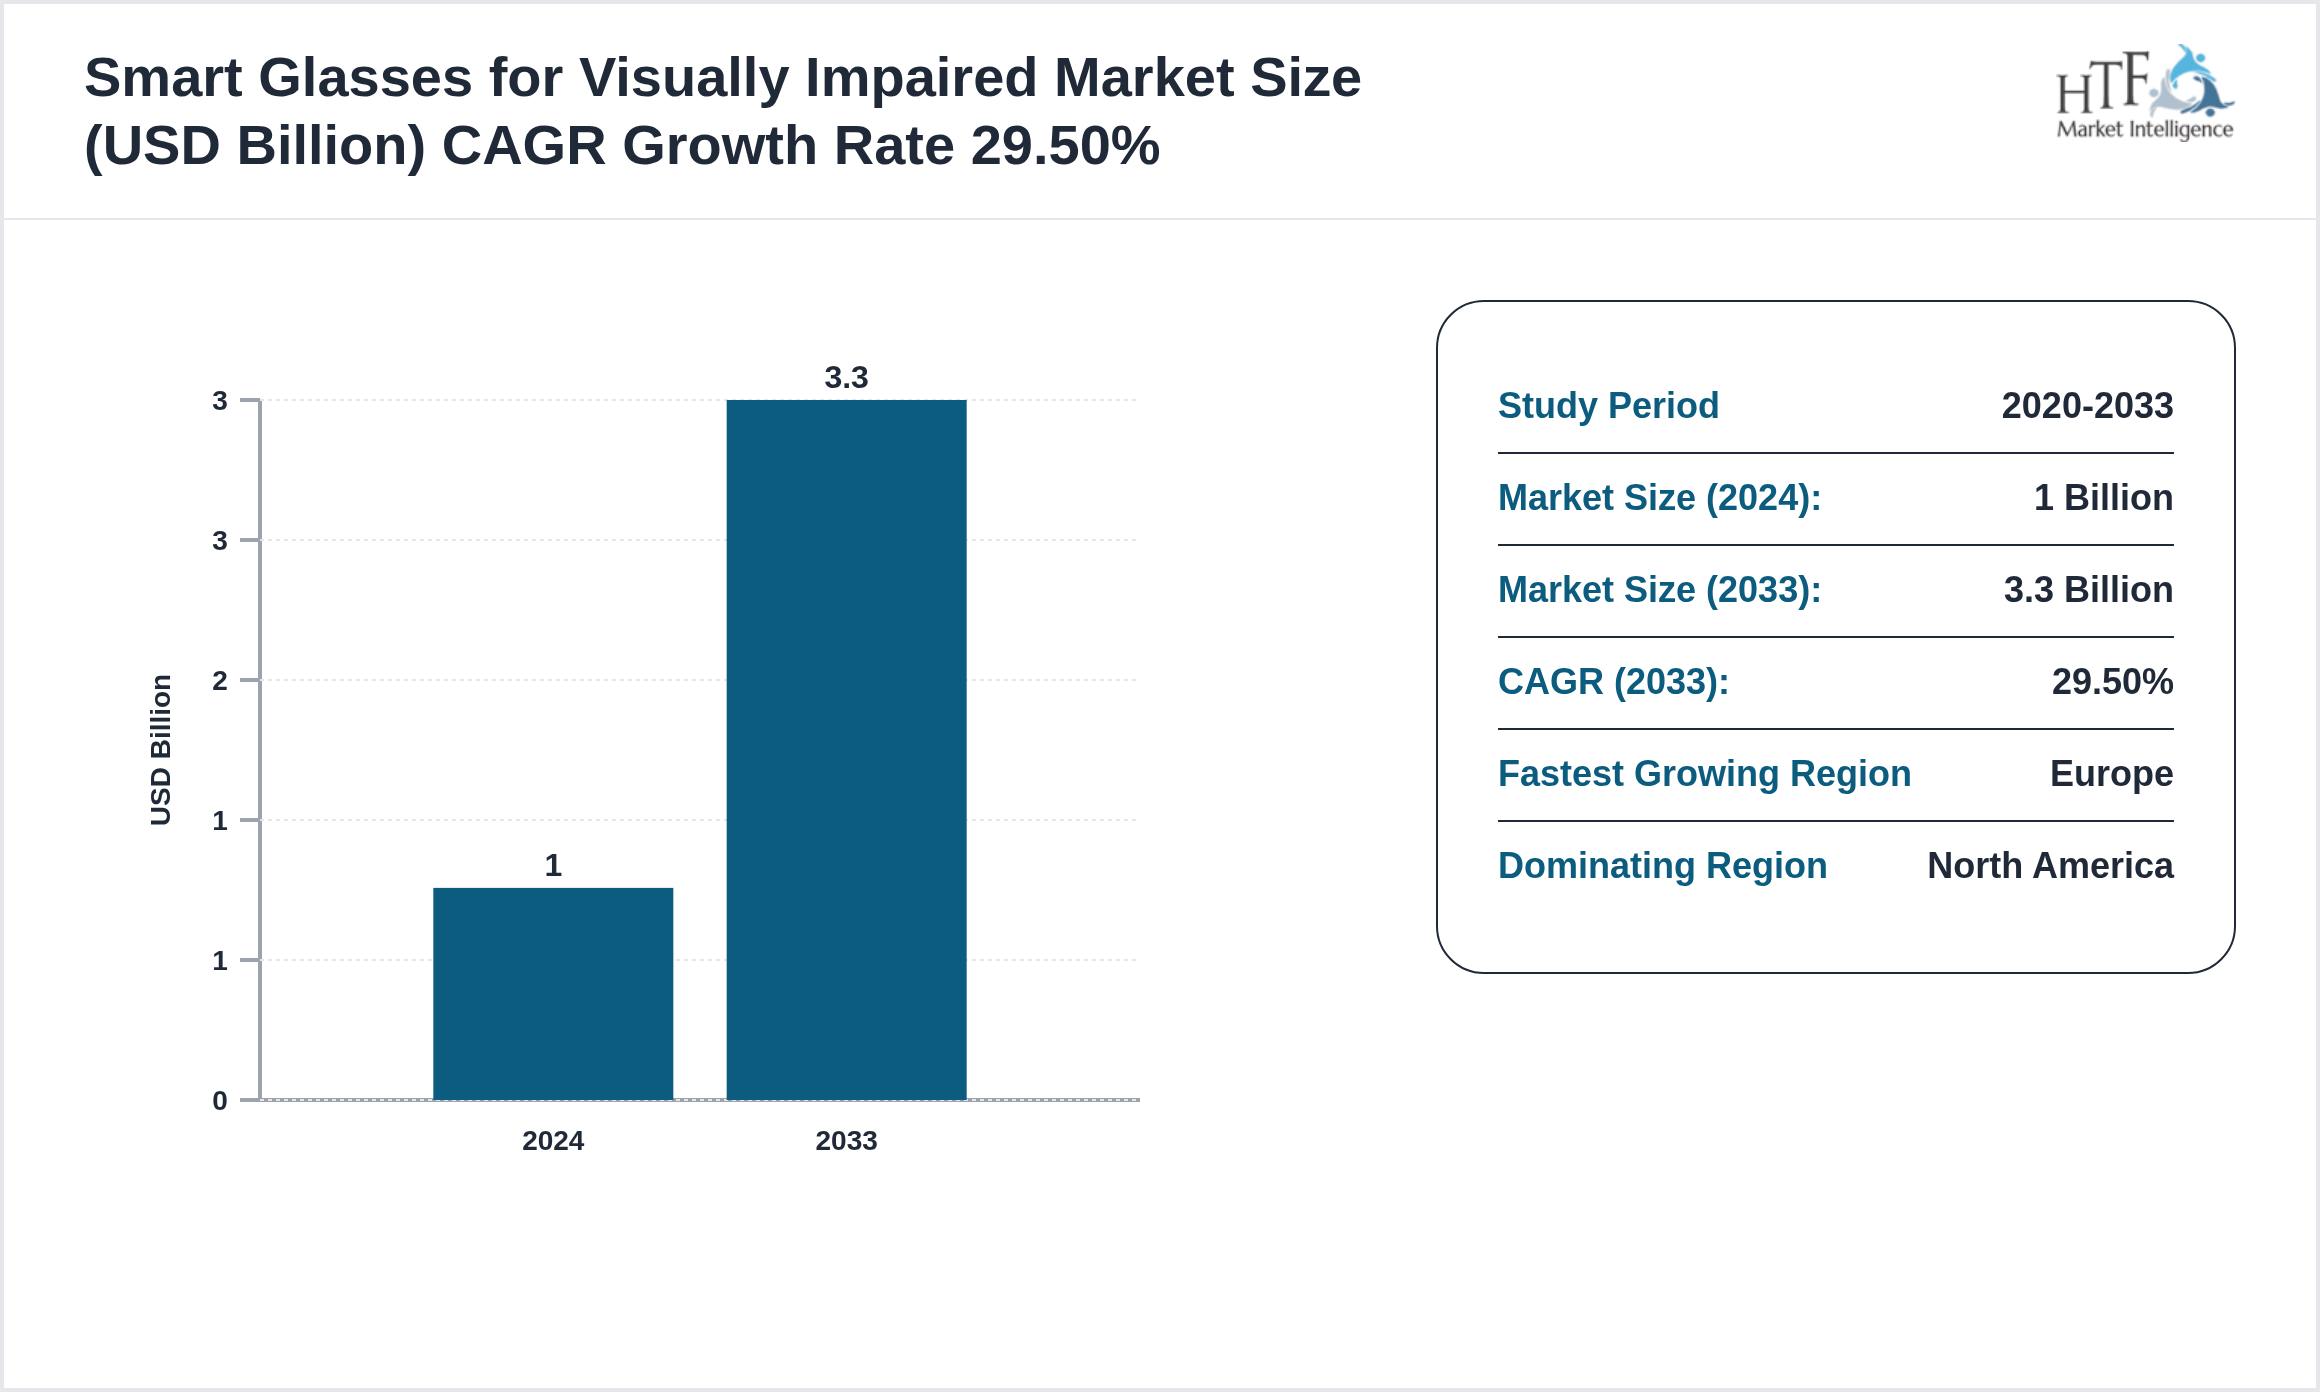
The Smart Glasses for Visually Impaired is Growing at 29.50% and is expected to reach 3.3 billion by 2033. Below mentioned are some of the dynamics shaping the Smart Glasses for Visually Impaired.
The smart glasses for visually impaired market focuses on wearable devices designed to assist people with vision impairments by providing augmented reality features, audio assistance, and real-time information. These glasses help users navigate their environment, read text, and perform everyday activities independently. The market is growing as advancements in AI and AR technologies are creating new possibilities for visually impaired individuals, promoting accessibility and inclusion.
Market Drivers:
The key drivers in the market include technological advancements, increasing demand by consumers for innovative products, and government-friendly policies.
- • Rising Awareness Of Vision Impairments
- • Increasing Demand For Independent Living Solutions
- • Growing Focus On Assistive Technologies
- • Government Support For Accessibility Solutions
- • Need For Real-Time Visual Information
Some of the restraints to market growth may include regulatory challenges, high production costs, and disruptions in the supply chain.
- • Expansion In Assistive Technologies
- • Growth Of Accessibility Services
- • Increase In Government Funding For Health Solutions
- • Development Of Wearable Tech For Blind Users
- • Integration With Navigation Systems
Among the trending ones are sustainability, digital transformation, and the increasing importance of data analytics.
- • Rise Of AI-Powered Vision Aids
- • Focus On Integration With Mobile Apps
- • Development Of Voice-Controlled Smart Glasses
- • Growth Of Wearable Health Solutions
- • Expansion Of Subscription Services For Blind/Visually Impaired
These include emerging markets, innovation in product development, and strategic partnerships.
- • High Costs
- • Consumer Hesitancy
- • Limited Availability In Some Regions
- • Technical Challenges
- • Lack Of Widespread Adoption
Regulation Shaping the Healthcare Industry
The healthcare industry is significantly influenced by a complex framework of regulations designed to ensure patient safety, efficacy of treatments, and the overall quality of care. Key regulatory areas include drug approval processes, medical device standards, and healthcare data protection. These regulations aim to maintain high standards for clinical practices and safeguard public health.
SWOT Analysis in the Healthcare Industry
SWOT analysis in the healthcare industry involves a structured assessment of strengths, weaknesses, opportunities, and threats to identify strategic advantages and areas for improvement.
• Strengths: Evaluates internal factors such as advanced technology, skilled personnel, and strong brand reputation. For example, a hospital with cutting-edge medical equipment and specialized staff is considered to have a strong competitive edge.
• Weaknesses: Identifies internal limitations like outdated facilities, regulatory compliance issues, or high operational costs. Weaknesses could include inefficient processes or lack of innovation.
• Opportunities: Assesses external factors that could drive growth, such as emerging medical technologies, expanding markets, or favorable government policies. Opportunities might involve partnerships or new service lines.
• Threats: Examines external challenges such as increasing competition, changing regulations, or economic downturns. Threats might include new entrants with disruptive technologies or stricter regulatory requirements.
Market Segmentation
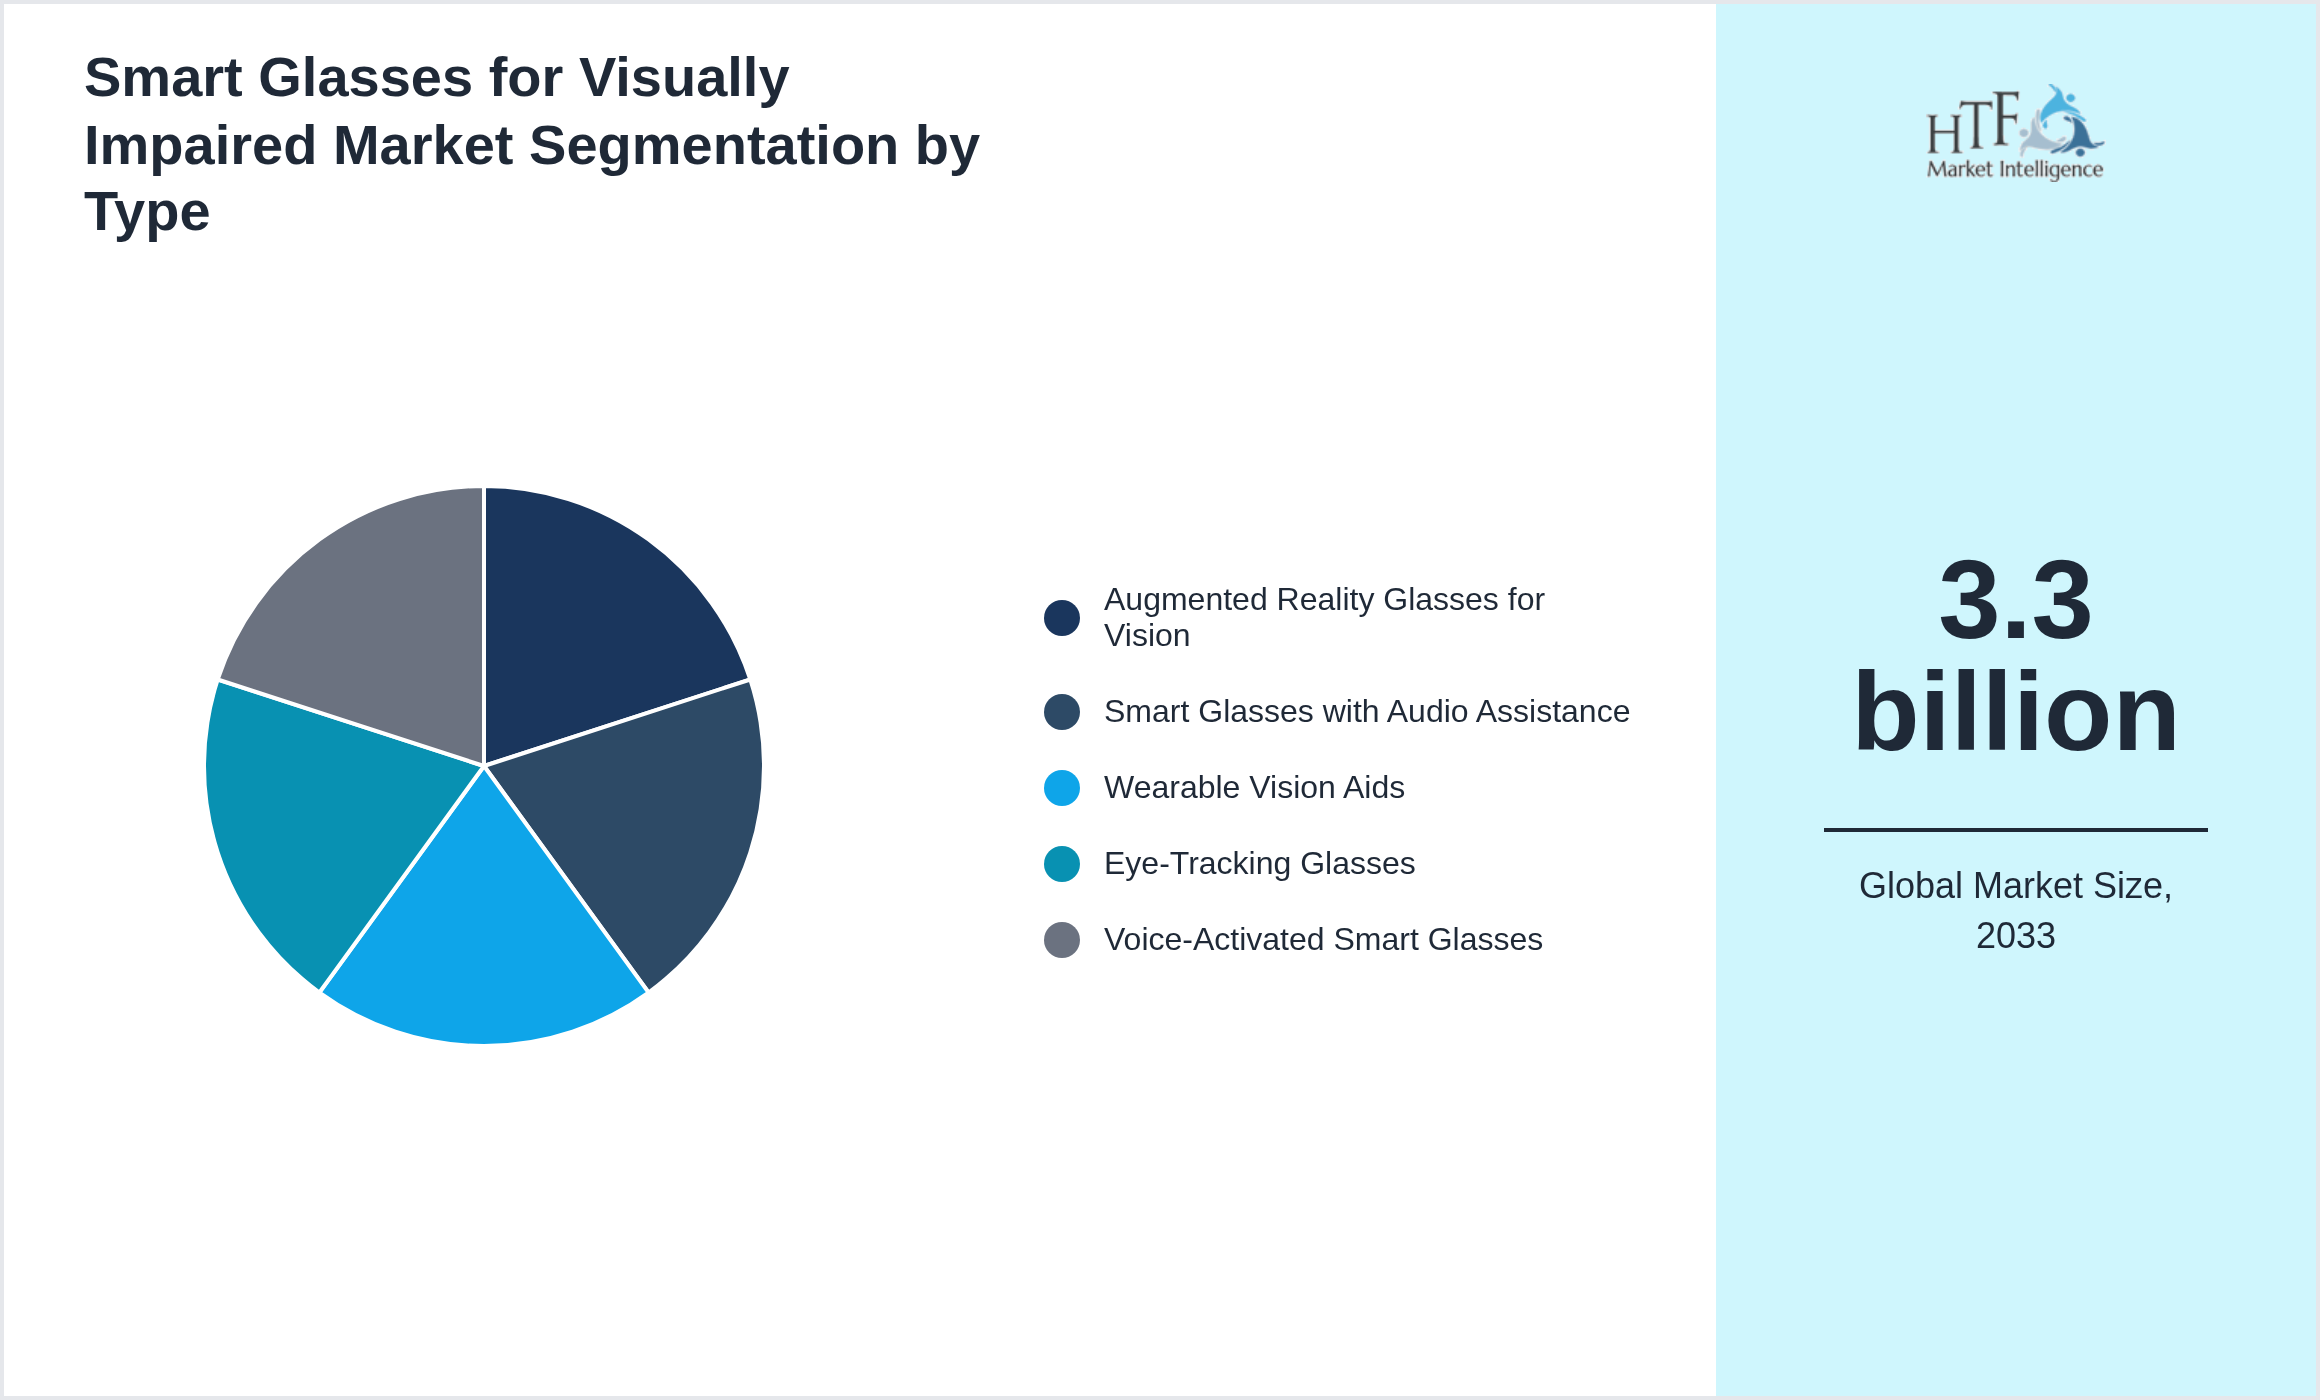
Segmentation by Type
- • Augmented Reality Glasses for Vision
- • Smart Glasses with Audio Assistance
- • Wearable Vision Aids
- • Eye-Tracking Glasses
- • Voice-Activated Smart Glasses
Segmentation by Application
- • Healthcare
- • Personal Assistance
- • Navigation
- • Education
- • Mobility Services

Regional Outlook
The North America currently holds a significant share of the market, primarily due to several key factors: increasing consumption rates, a burgeoning population, and robust economic momentum. These elements collectively drive demand, positioning this region as a leader in the market. On the other hand, Europe is rapidly emerging as the fastest-growing area within the industry. This remarkable growth can be attributed to swift infrastructure development, the expansion of various industrial sectors, and a marked increase in consumer demand. These dynamics make this region a crucial player in shaping future market growth. In our report, we cover a comprehensive analysis of the regions and countries, including
- North America
- LATAM
- West Europe
- Central & Eastern Europe
- Northern Europe
- Southern Europe
- East Asia
- Southeast Asia
- South Asia
- Central Asia
- Oceania
- MEA
The company consistently allocates significant resources to expand its research capabilities, develop new medical technologies, and enhance its pharmaceutical portfolio. Johnson & Johnson's investments in R&D, coupled with strategic acquisitions and partnerships, reinforce its position as a major contributor to advancements in healthcare. This focus on innovation and market expansion underscores the critical importance of the North American region in the global healthcare landscape.
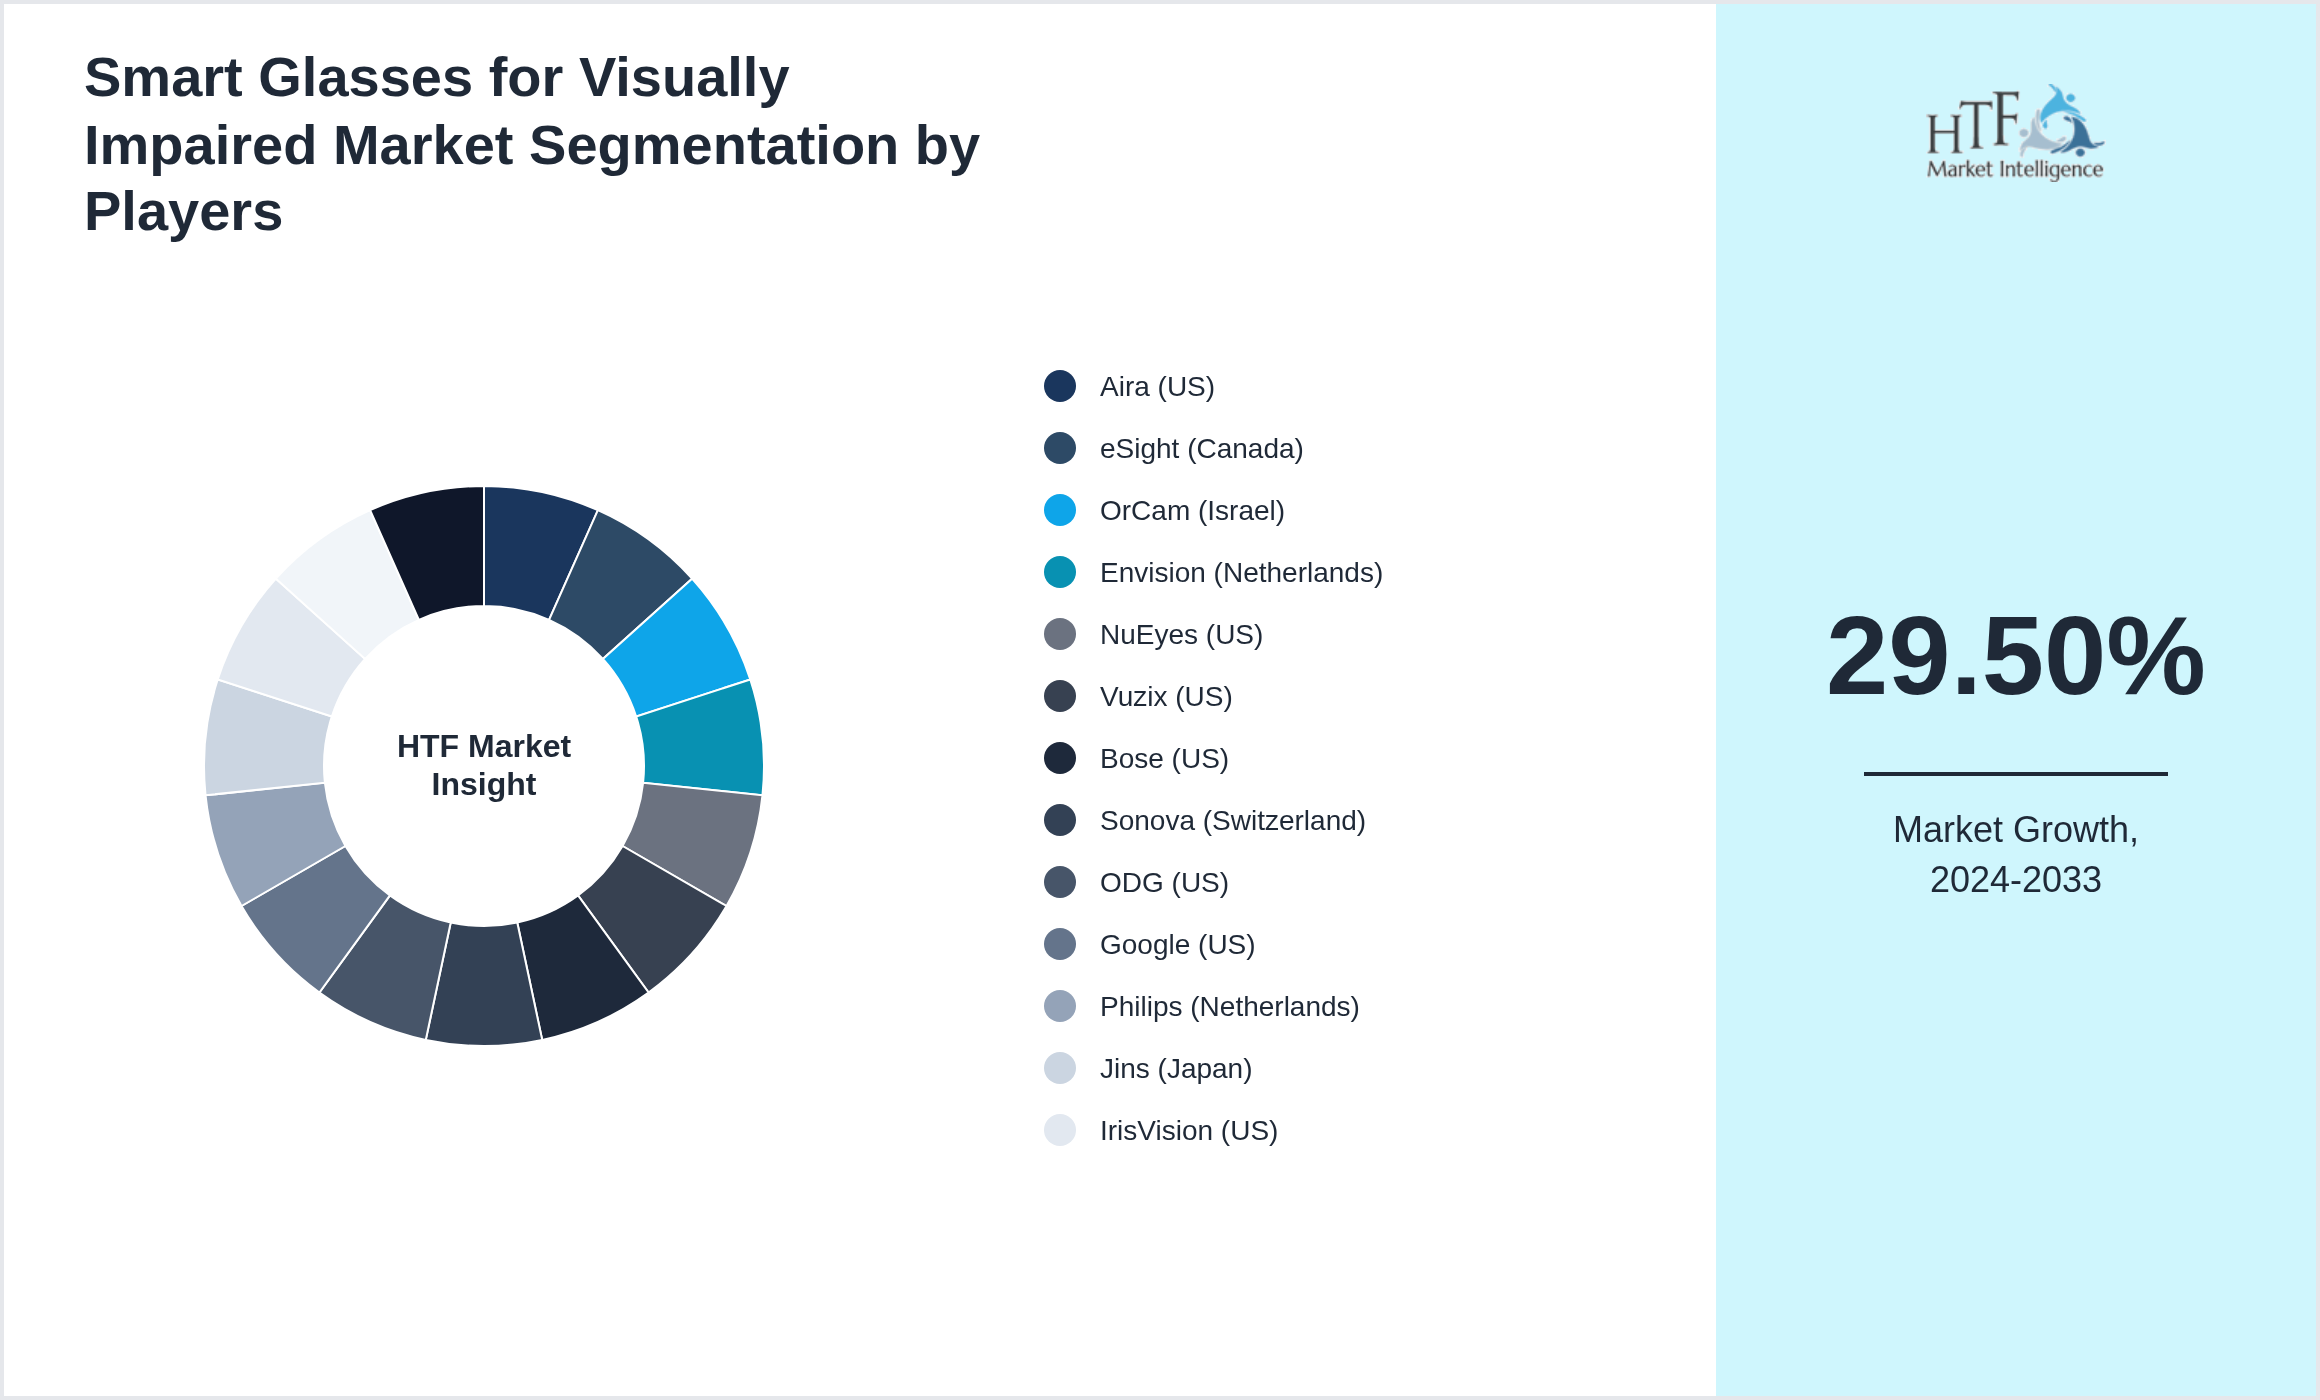
- • Aira (US)
- • eSight (Canada)
- • OrCam (Israel)
- • Envision (Netherlands)
- • NuEyes (US)
- • Vuzix (US)
- • Bose (US)
- • Sonova (Switzerland)
- • ODG (US)
- • Google (US)
- • Philips (Netherlands)
- • Jins (Japan)
- • IrisVision (US)
- • Wearable X (US)
- • Tokyo Medical (Japan)
Merger & Acquisition
Primary and Secondary Research
Primary research involves the collection of original data directly from sources in the healthcare industry. Approaches include the survey of health professionals, interviews with patients, focus groups, and clinical trials. This gives an overview of the current practice, the needs of the patient, and the interest in emerging trends. Firsthand information on the efficacy of new treatments, an assessment of market demand, and insight into changes in regulation can be sought only with primary research.
Secondary Research: This is the investigation of existing information from a variety of sources, which may include industry reports, academic journals, government publications, and market research studies. Alfred secondary research empowers them to understand trends within industries, historical data, and competitive landscapes. It gives a wide view of the market dynamics and validates findings obtained from primary research. By combining both primary and secondary together, health organizations will be empowered to develop comprehensive strategies and make informed decisions based on a strong foundation built on data.
Report Infographics
|
Report Features |
Details |
|
Base Year |
2024 |
|
Based Year Market Size (BASE_YEAR) |
1.0 billion |
|
Historical Period |
2020 to 2024 |
|
CAGR (2024 to 2033) |
29.50% |
|
Forecast Period |
2024 to 2033 |
|
Forecasted Period Market Size (2033) |
3.3 billion |
|
Scope of the Report |
|
|
Regions Covered |
North America, LATAM, West Europe, Central & Eastern Europe, Northern Europe, Southern Europe, East Asia, Southeast Asia, South Asia, Central Asia, Oceania, MEA |
|
Companies Covered |
Aira (US), eSight (Canada), OrCam (Israel), Envision (Netherlands), NuEyes (US), Vuzix (US), Bose (US), Sonova (Switzerland), ODG (US), Google (US), Philips (Netherlands), Jins (Japan), IrisVision (US), Wearable X (US), Tokyo Medical (Japan) |
|
Customization Scope |
15% Free Customization (For EG) |
|
Delivery Format |
PDF and Excel through Email |
Smart Glasses for Visually Impaired - Table of Contents
Chapter 1: Market Preface
Chapter 2: Strategic Overview
Chapter 3: Global Smart Glasses for Visually Impaired Market Business Environment & Changing Dynamics
Chapter 4: Global Smart Glasses for Visually Impaired Industry Factors Assessment
Chapter 5: Smart Glasses for Visually Impaired : Competition Benchmarking & Performance Evaluation
Chapter 6: Global Smart Glasses for Visually Impaired Market: Company Profiles
Chapter 7: Global Smart Glasses for Visually Impaired by Type & Application (2020-2033)
Chapter 8: North America Smart Glasses for Visually Impaired Market Breakdown by Country, Type & Application
Chapter 9: Europe Smart Glasses for Visually Impaired Market Breakdown by Country, Type & Application
Chapter 10: Asia Pacific Smart Glasses for Visually Impaired Market Breakdown by Country, Type & Application
Chapter 11: Latin America Smart Glasses for Visually Impaired Market Breakdown by Country, Type & Application
Chapter 12: Middle East & Africa Smart Glasses for Visually Impaired Market Breakdown by Country, Type & Application
Chapter 13: Research Finding and Conclusion
Frequently Asked Questions (FAQ):
The Compact Track Loaders market is expected to see value worth 5.3 Billion in 2025.
North America currently leads the market with approximately 45% market share, followed by Europe at 28% and Asia-Pacific at 22%. The remaining regions account for 5% of the global market.
Key growth drivers include increasing construction activities, rising demand for versatile equipment in agriculture, technological advancements in track loader design, and growing preference for compact equipment in urban construction projects.