
Resource Allocation Market Segmentation & Regional Sizing
Global Resource Allocation Market is segmented by Application (Healthcare, Disaster Relief, Education, Energy, Urban Planning), Type (Resource Optimization Platforms, Predictive Allocation Engines, Data-Driven Planning Tools, Government Budget Analytics, Workforce Allocation Systems), and Geography (North America, LATAM, West Europe, Central & Eastern Europe, Northern Europe, Southern Europe, East Asia, Southeast Asia, South Asia, Central Asia, Oceania, MEA)
Pricing
Report Overview
INDUSTRY OVERVIEW
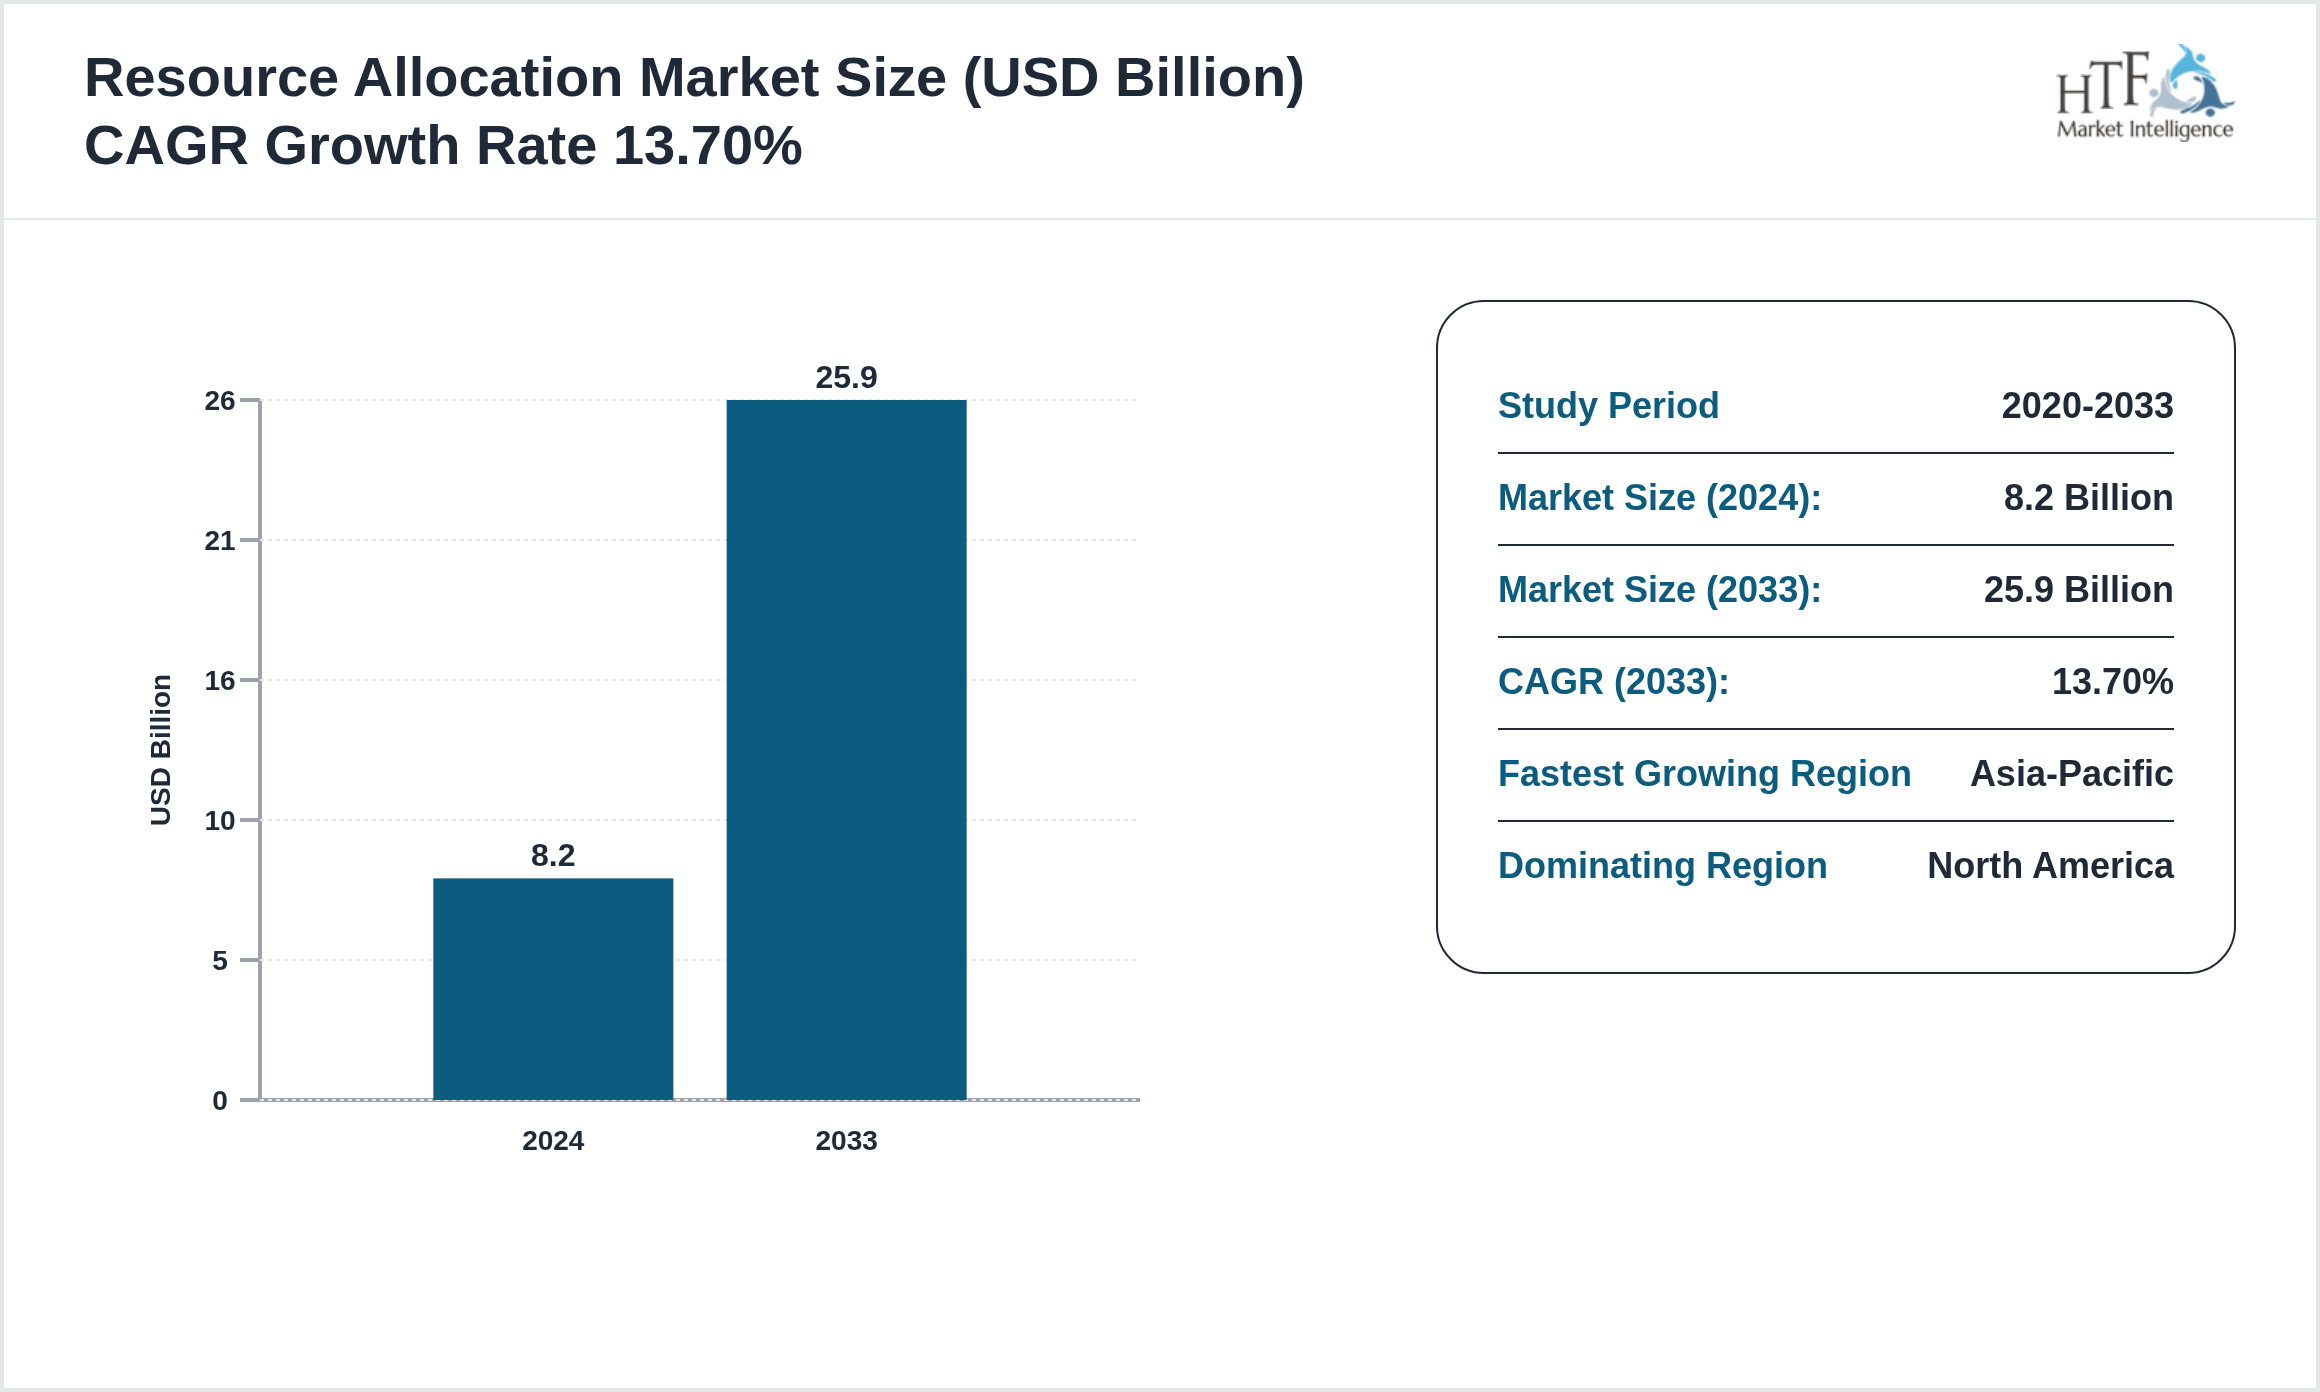
The Resource Allocation is growing at 13.70% and is expected to reach 25.9 billion by 2033. The below-mentioned are some of the dynamics shaping the Resource Allocation.
Resource Allocation solutions use advanced analytics, AI, and data visualization to optimize the distribution of financial, human, and infrastructural resources. Governments, NGOs, and corporations employ these platforms to forecast demand, identify shortages, and ensure equitable resource delivery across regions and programs.
Source: HTF Market Intelligence (HTF MI)
Understand Key Market Dynamics
Market Dynamics
Market Drivers:
The key drivers in the market include technological advancements, increasing demand by consumers for innovative products, and government-friendly policies.
- • Rising Government Modernization
- • Focus On Data-Driven Planning
- • Adoption Of Predictive Analytics
- • Global Development Funding Growth
- • Integration Of Cloud In Governance
Some of the restraints to market growth may include regulatory challenges, high production costs, and disruptions in the supply chain.
- • Data Fragmentation
- • Lack Of Skilled Data Professionals
- • Resistance To Change
- • Limited Interagency Coordination
- • Cybersecurity Risks
Among the trending ones are sustainability, digital transformation, and the increasing importance of data analytics.
- • AI-Driven Decision Support
- • Scenario-Based Budget Modeling
- • Blockchain Transparency Systems
- • Cross-Sector Data Sharing
- • Geospatial Resource Mapping
These include emerging markets, innovation in product development, and strategic partnerships.
- • Expansion Into Emerging Economies
- • Collaboration With Donors & NGOs
- • Integration With Climate Adaptation Tools
- • Smart Urban Resource Management
- • National Budget Transparency Projects
Regulation Shaping the Healthcare Industry
The healthcare industry is significantly influenced by a complex framework of regulations designed to ensure patient safety, the efficacy of treatments, and the overall quality of care. Key regulatory areas include drug approval processes, medical device standards, and healthcare data protection. These regulations aim to maintain high standards for clinical practices and safeguard public health.
Get More Details on the Resource Allocation Market Study
SWOT Analysis in the Healthcare Industry
SWOT analysis in the healthcare industry involves a structured assessment of strengths, weaknesses, opportunities, and threats to identify strategic advantages and areas for improvement.
• Strengths: Evaluates internal factors such as advanced technology, skilled personnel, and strong brand reputation. For example, a hospital with cutting-edge medical equipment and specialized staff is considered to have a strong competitive edge.
• Weaknesses: Identifies internal limitations like outdated facilities, regulatory compliance issues, or high operational costs. Weaknesses could include inefficient processes or lack of innovation.
• Opportunities: Assesses external factors that could drive growth, such as emerging medical technologies, expanding markets, or favorable government policies. Opportunities might involve partnerships or new service lines.
• Threats: Examines external challenges such as increasing competition, changing regulations, or economic downturns. Threats might include new entrants with disruptive technologies or stricter regulatory requirements.
Market Segmentation
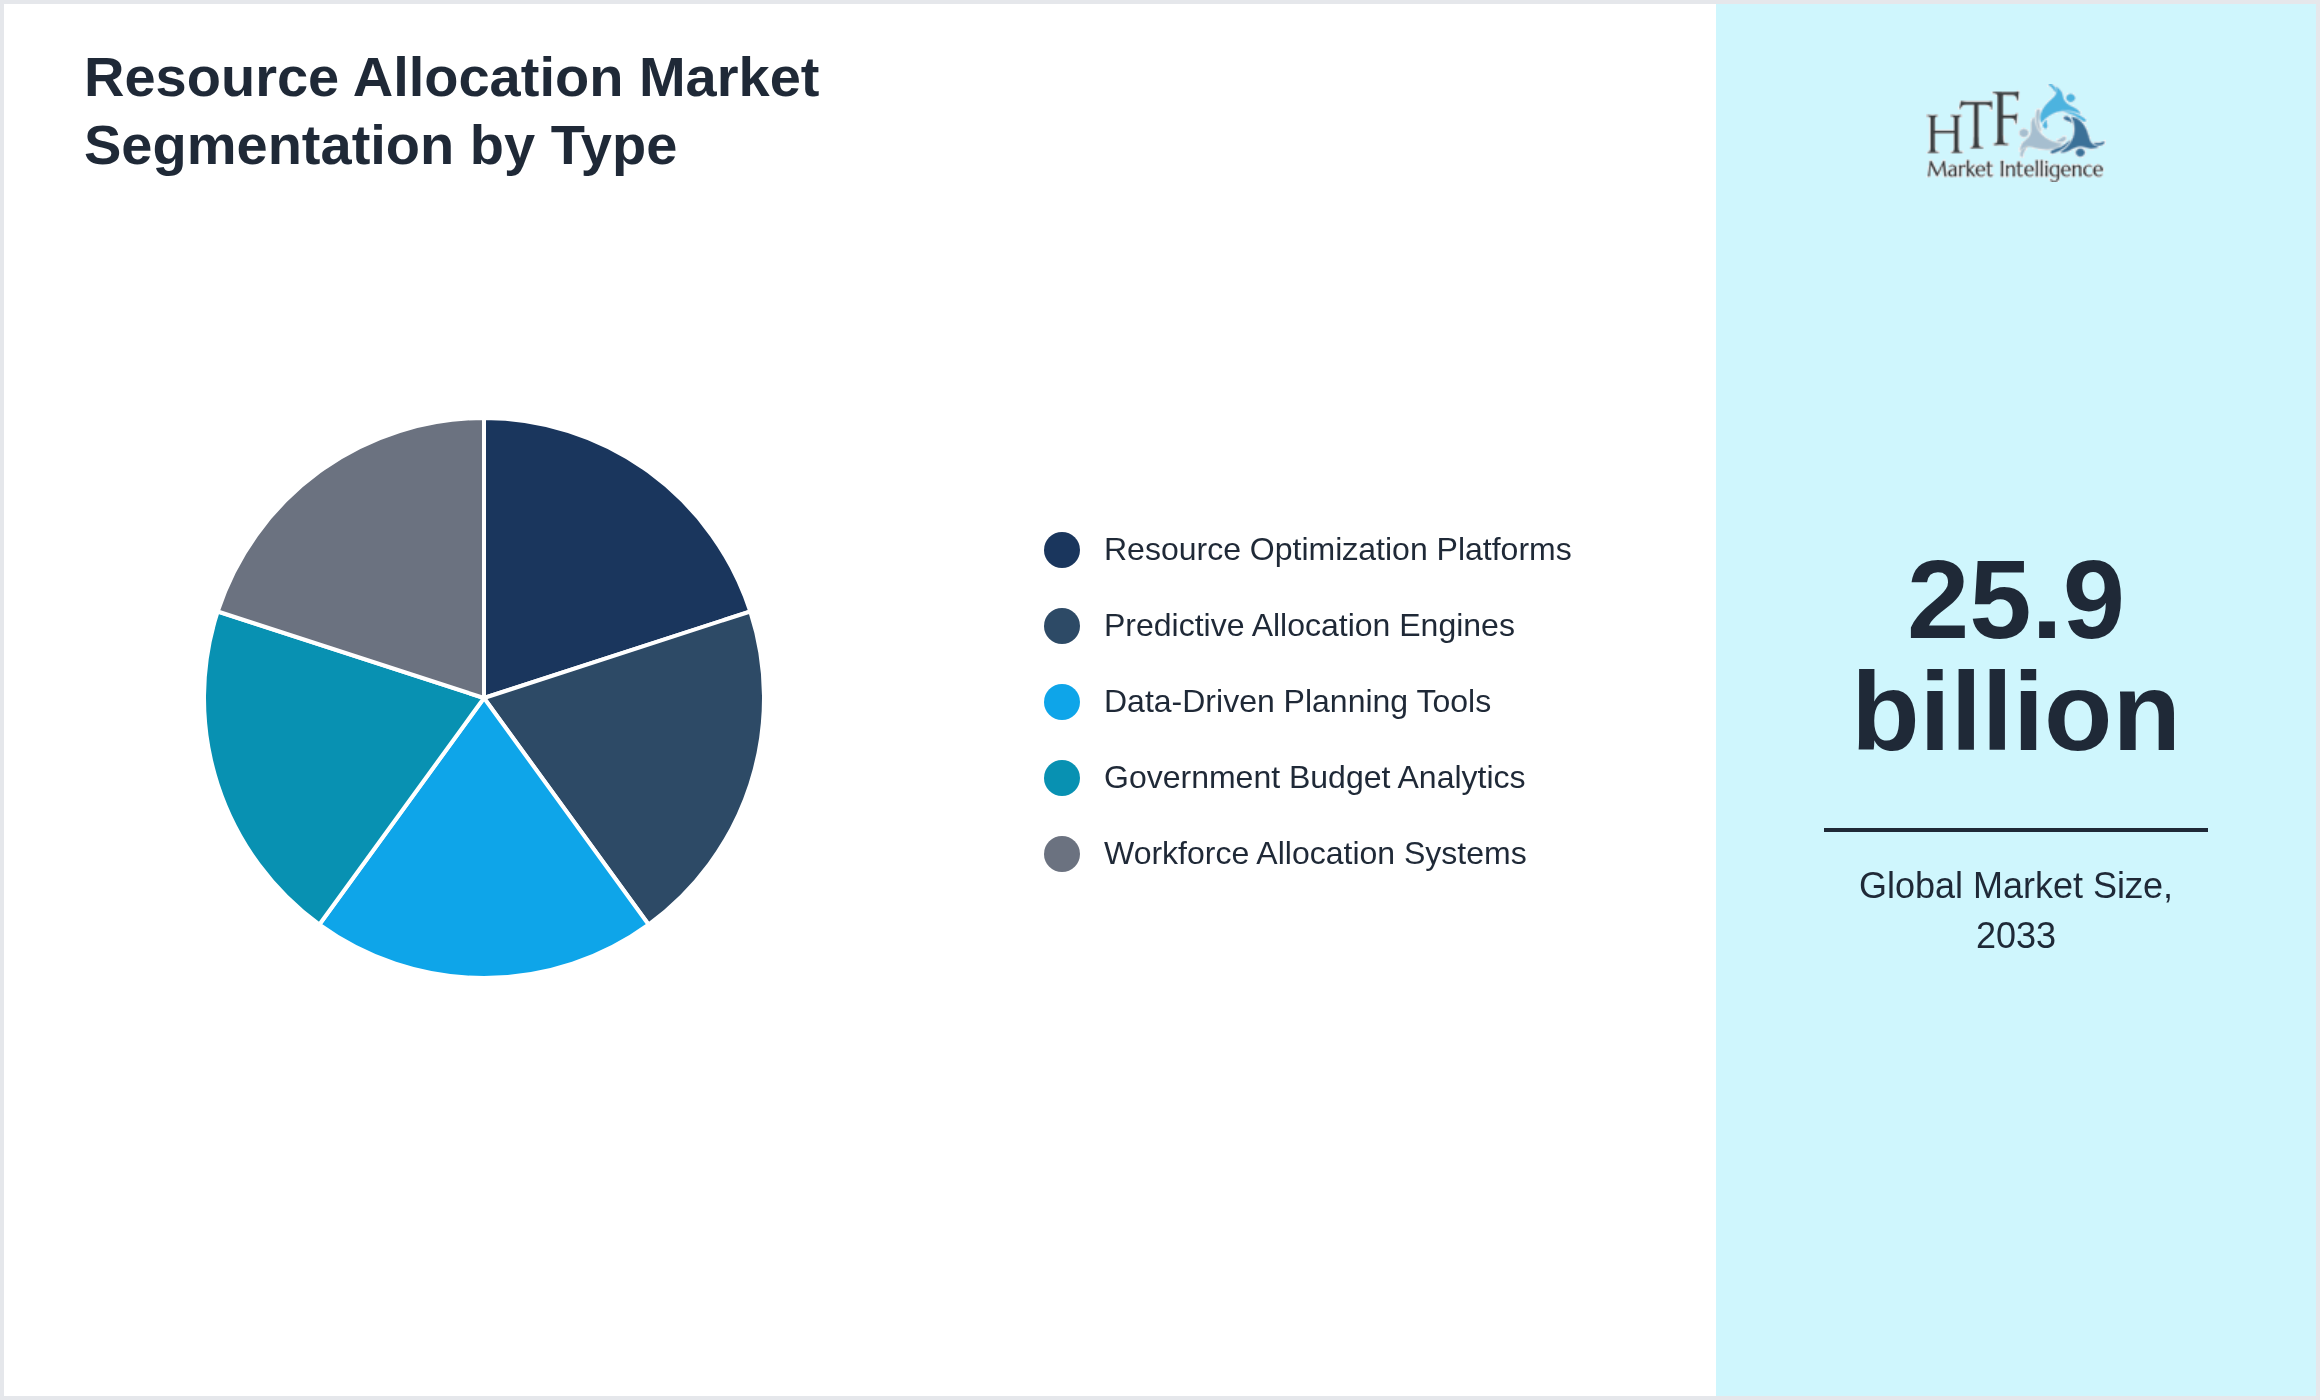
Segmentation by Type
- • Resource Optimization Platforms
- • Predictive Allocation Engines
- • Data-Driven Planning Tools
- • Government Budget Analytics
- • Workforce Allocation Systems
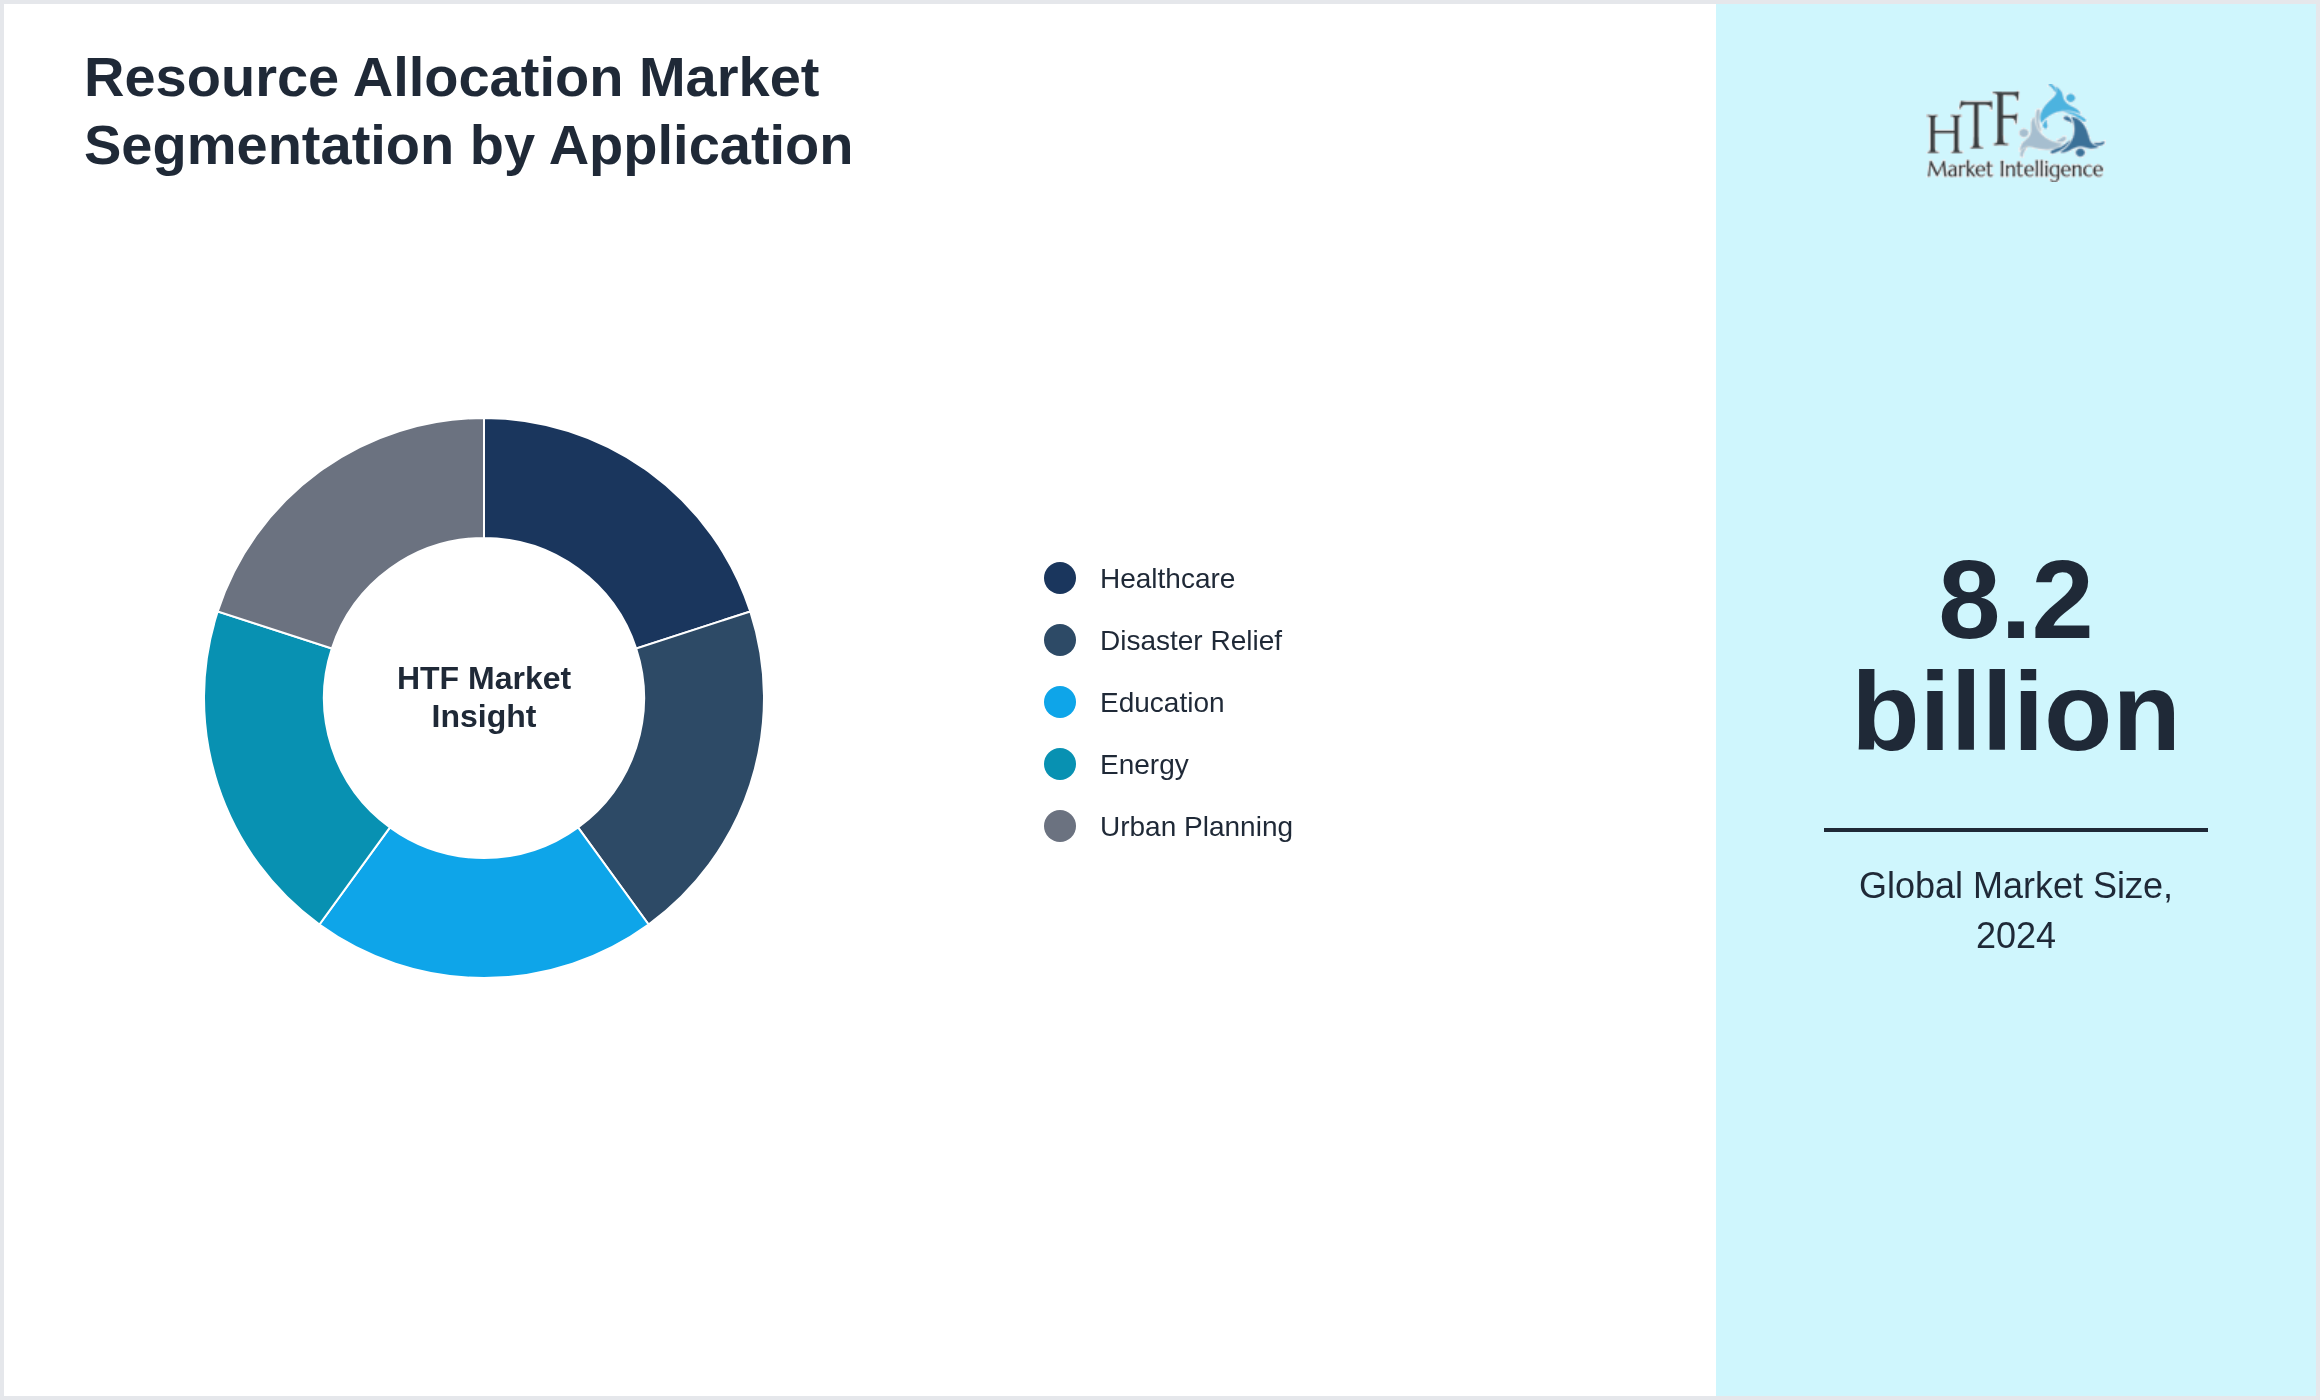
Segmentation by Application
- • Healthcare
- • Disaster Relief
- • Education
- • Energy
- • Urban Planning
Regional Outlook
The North America currently holds a significant share of the market, primarily due to several key factors: increasing consumption rates, a burgeoning population, and robust economic momentum. These elements collectively drive demand, positioning this region as a leader in the market. On the other hand, Asia-Pacific is rapidly emerging as the fastest-growing area within the industry. This remarkable growth can be attributed to swift infrastructure development, the expansion of various industrial sectors, and a marked increase in consumer demand. These dynamics make this region a crucial player in shaping future market growth. In our report, we cover a comprehensive analysis of the regions and countries, including
- North America
- LATAM
- West Europe
- Central & Eastern Europe
- Northern Europe
- Southern Europe
- East Asia
- Southeast Asia
- South Asia
- Central Asia
- Oceania
- MEA
The company consistently allocates significant resources to expand its research capabilities, develop new medical technologies, and enhance its pharmaceutical portfolio. Johnson & Johnson's investments in R&D, coupled with strategic acquisitions and partnerships, reinforce its position as a major contributor to advancements in healthcare. This focus on innovation and market expansion underscores the critical importance of the North American region in the global healthcare landscape.
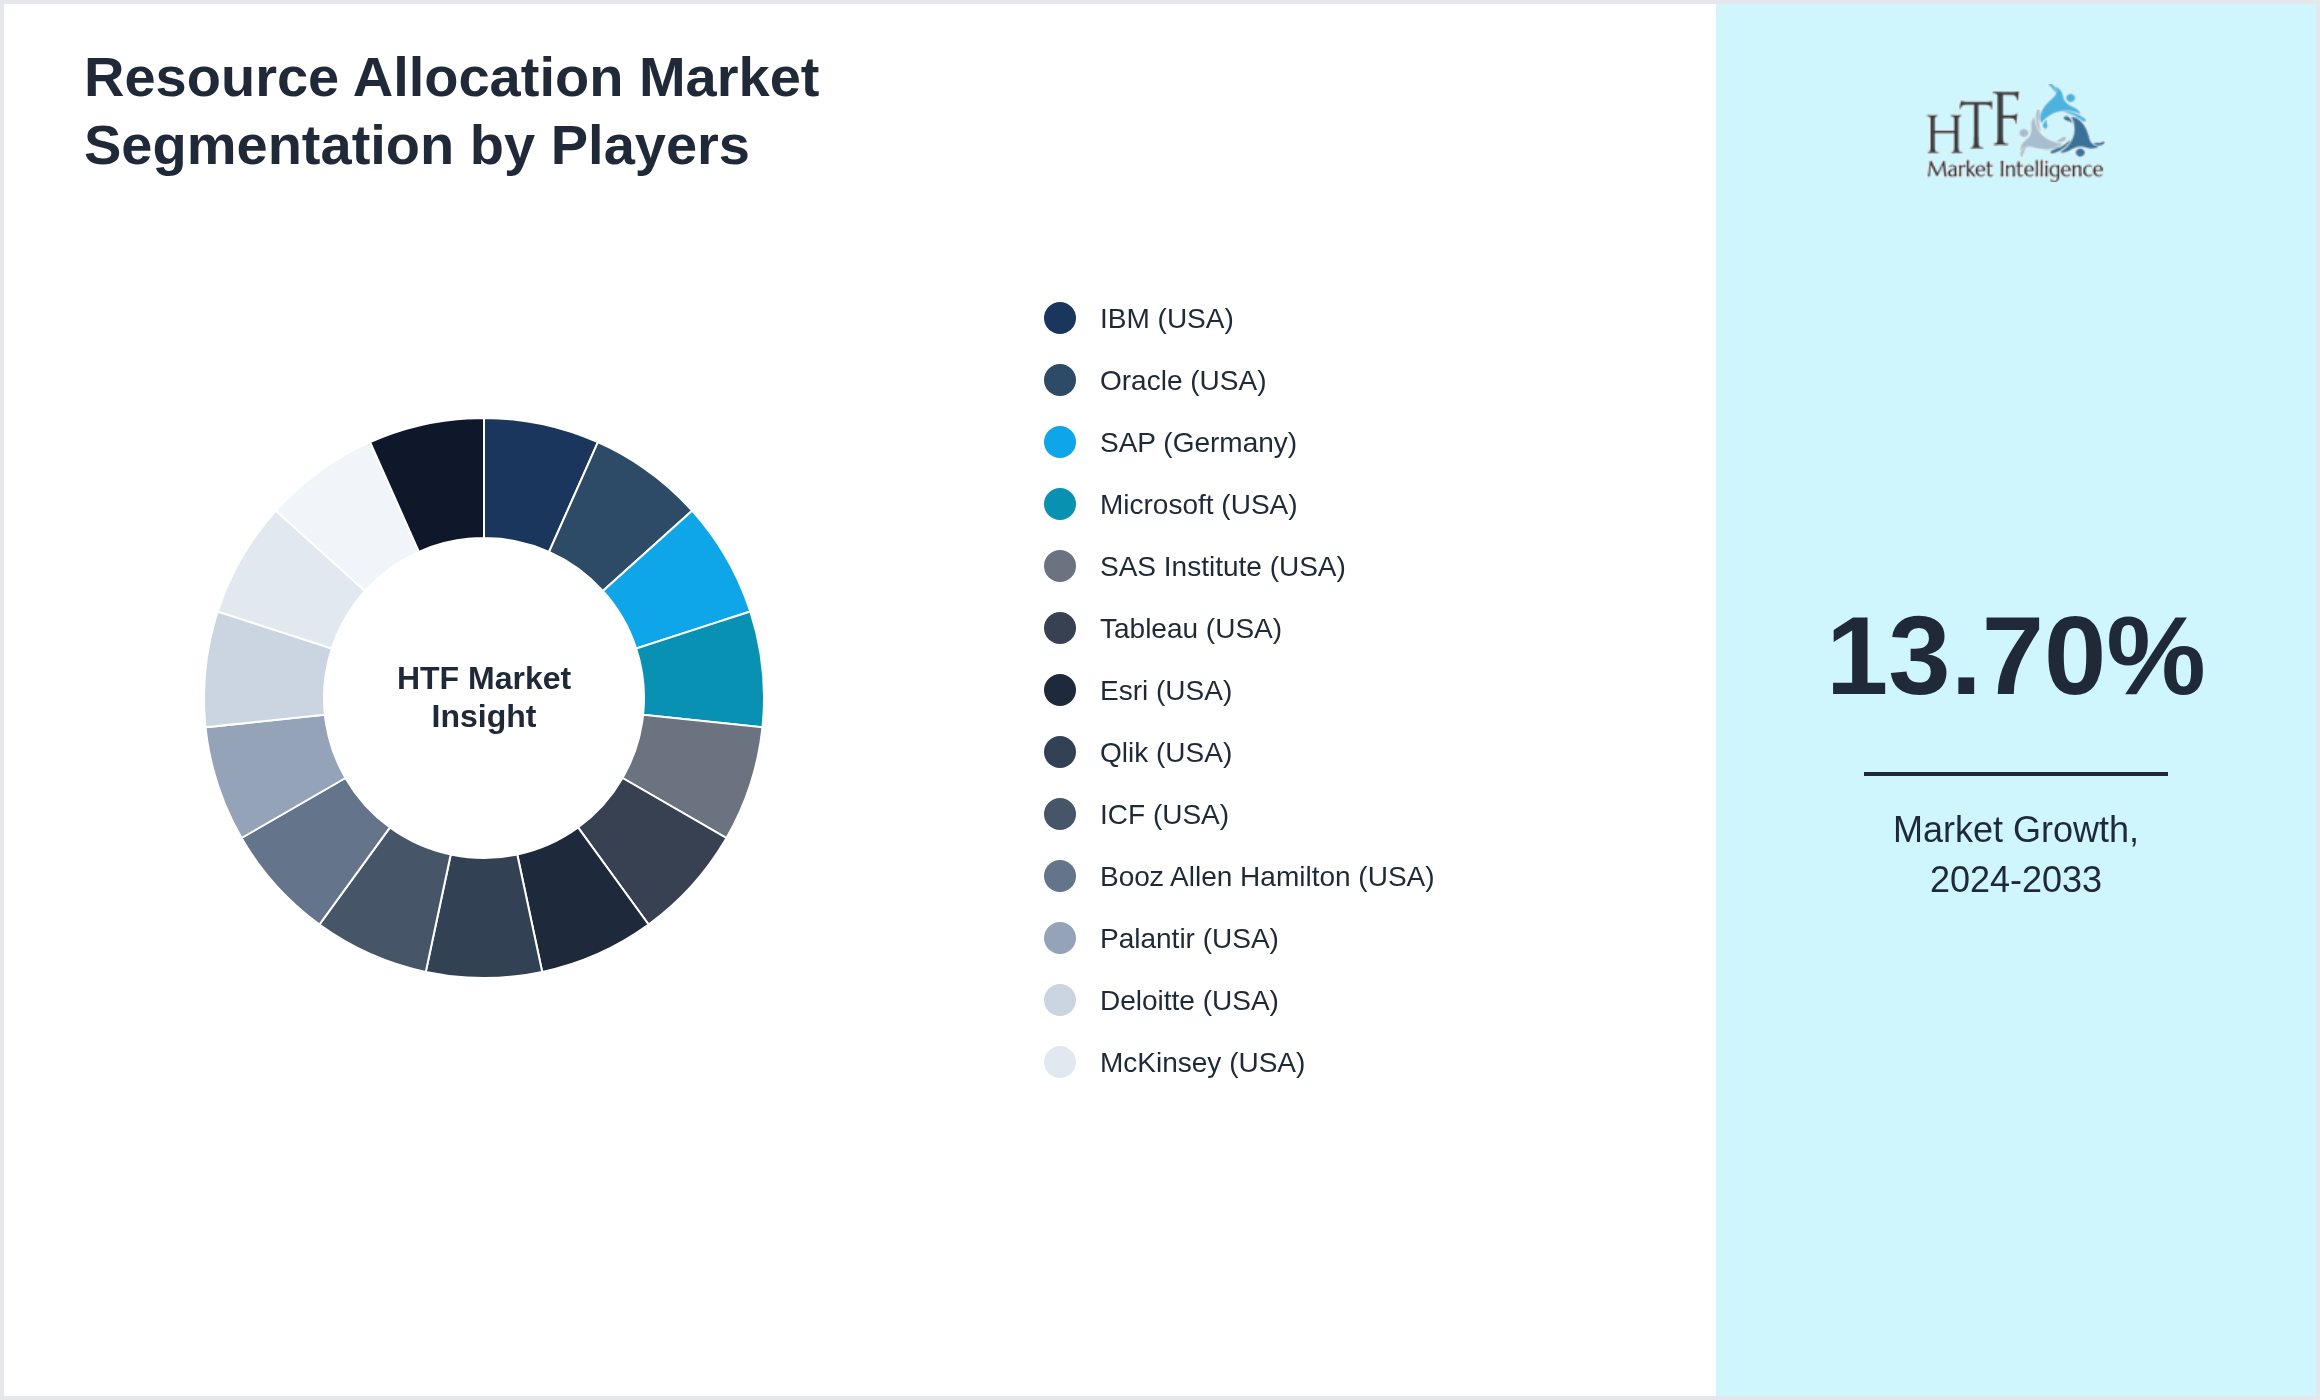
- • IBM (USA)
- • Oracle (USA)
- • SAP (Germany)
- • Microsoft (USA)
- • SAS Institute (USA)
- • Tableau (USA)
- • Esri (USA)
- • Qlik (USA)
- • ICF (USA)
- • Booz Allen Hamilton (USA)
- • Palantir (USA)
- • Deloitte (USA)
- • McKinsey (USA)
- • Capgemini (France)
- • AWS (USA)
Key Development Activities
Merger & Acquisition
Primary and Secondary Research
Primary research involves the collection of original data directly from sources in the healthcare industry. Approaches include the survey of health professionals, interviews with patients, focus groups, and clinical trials. This gives an overview of the current practice, the needs of the patient, and the interest in emerging trends. Firsthand information on the efficacy of new treatments, an assessment of market demand, and insight into changes in regulation can be sought only with primary research.
Secondary Research: This is the investigation of existing information from a variety of sources, which may include industry reports, academic journals, government publications, and market research studies. Alfred secondary research empowers them to understand trends within industries, historical data, and competitive landscapes. It gives a wide view of the market dynamics and validates findings obtained from primary research. By combining both primary and secondary together, health organizations will be empowered to develop comprehensive strategies and make informed decisions based on a strong foundation built on data.
Report Infographics
|
Report Features |
Details |
|
Base Year |
2024 |
|
Based Year Market Size (BASE_YEAR) |
8.2 billion |
|
Historical Period |
2020 to 2024 |
|
CAGR (2024 to 2033) |
13.70% |
|
Forecast Period |
2024 to 2033 |
|
Forecasted Period Market Size (2033) |
25.9 billion |
|
Scope of the Report |
Resource Optimization Platforms, Predictive Allocation Engines, Data-Driven Planning Tools, Government Budget Analytics, Workforce Allocation Systems, Healthcare, Disaster Relief, Education, Energy, Urban Planning |
|
Regions Covered |
North America, LATAM, West Europe, Central & Eastern Europe, Northern Europe, Southern Europe, East Asia, Southeast Asia, South Asia, Central Asia, Oceania, MEA |
|
Companies Covered |
IBM (USA), Oracle (USA), SAP (Germany), Microsoft (USA), SAS Institute (USA), Tableau (USA), Esri (USA), Qlik (USA), ICF (USA), Booz Allen Hamilton (USA), Palantir (USA), Deloitte (USA), McKinsey (USA), Capgemini (France), AWS (USA) |
|
Customization Scope |
15% Free Customization (For EG) |
|
Delivery Format |
PDF and Excel through Email |