
Blockchain Chemical Traceability Market - Global Growth Opportunities 2020-2033
Global Blockchain Chemical Traceability Market is segmented by Application (Tracking, Certification, Hazardous goods, Sustainability audits, Drug chemicals), Type (Public blockchain, Private blockchain, Hybrid blockchain, Tokenized traceability, Compliance blockchain), and Geography (North America, LATAM, West Europe, Central & Eastern Europe, Northern Europe, Southern Europe, East Asia, Southeast Asia, South Asia, Central Asia, Oceania, MEA)
Pricing
Report Overview
Key Aspects of the Market Report
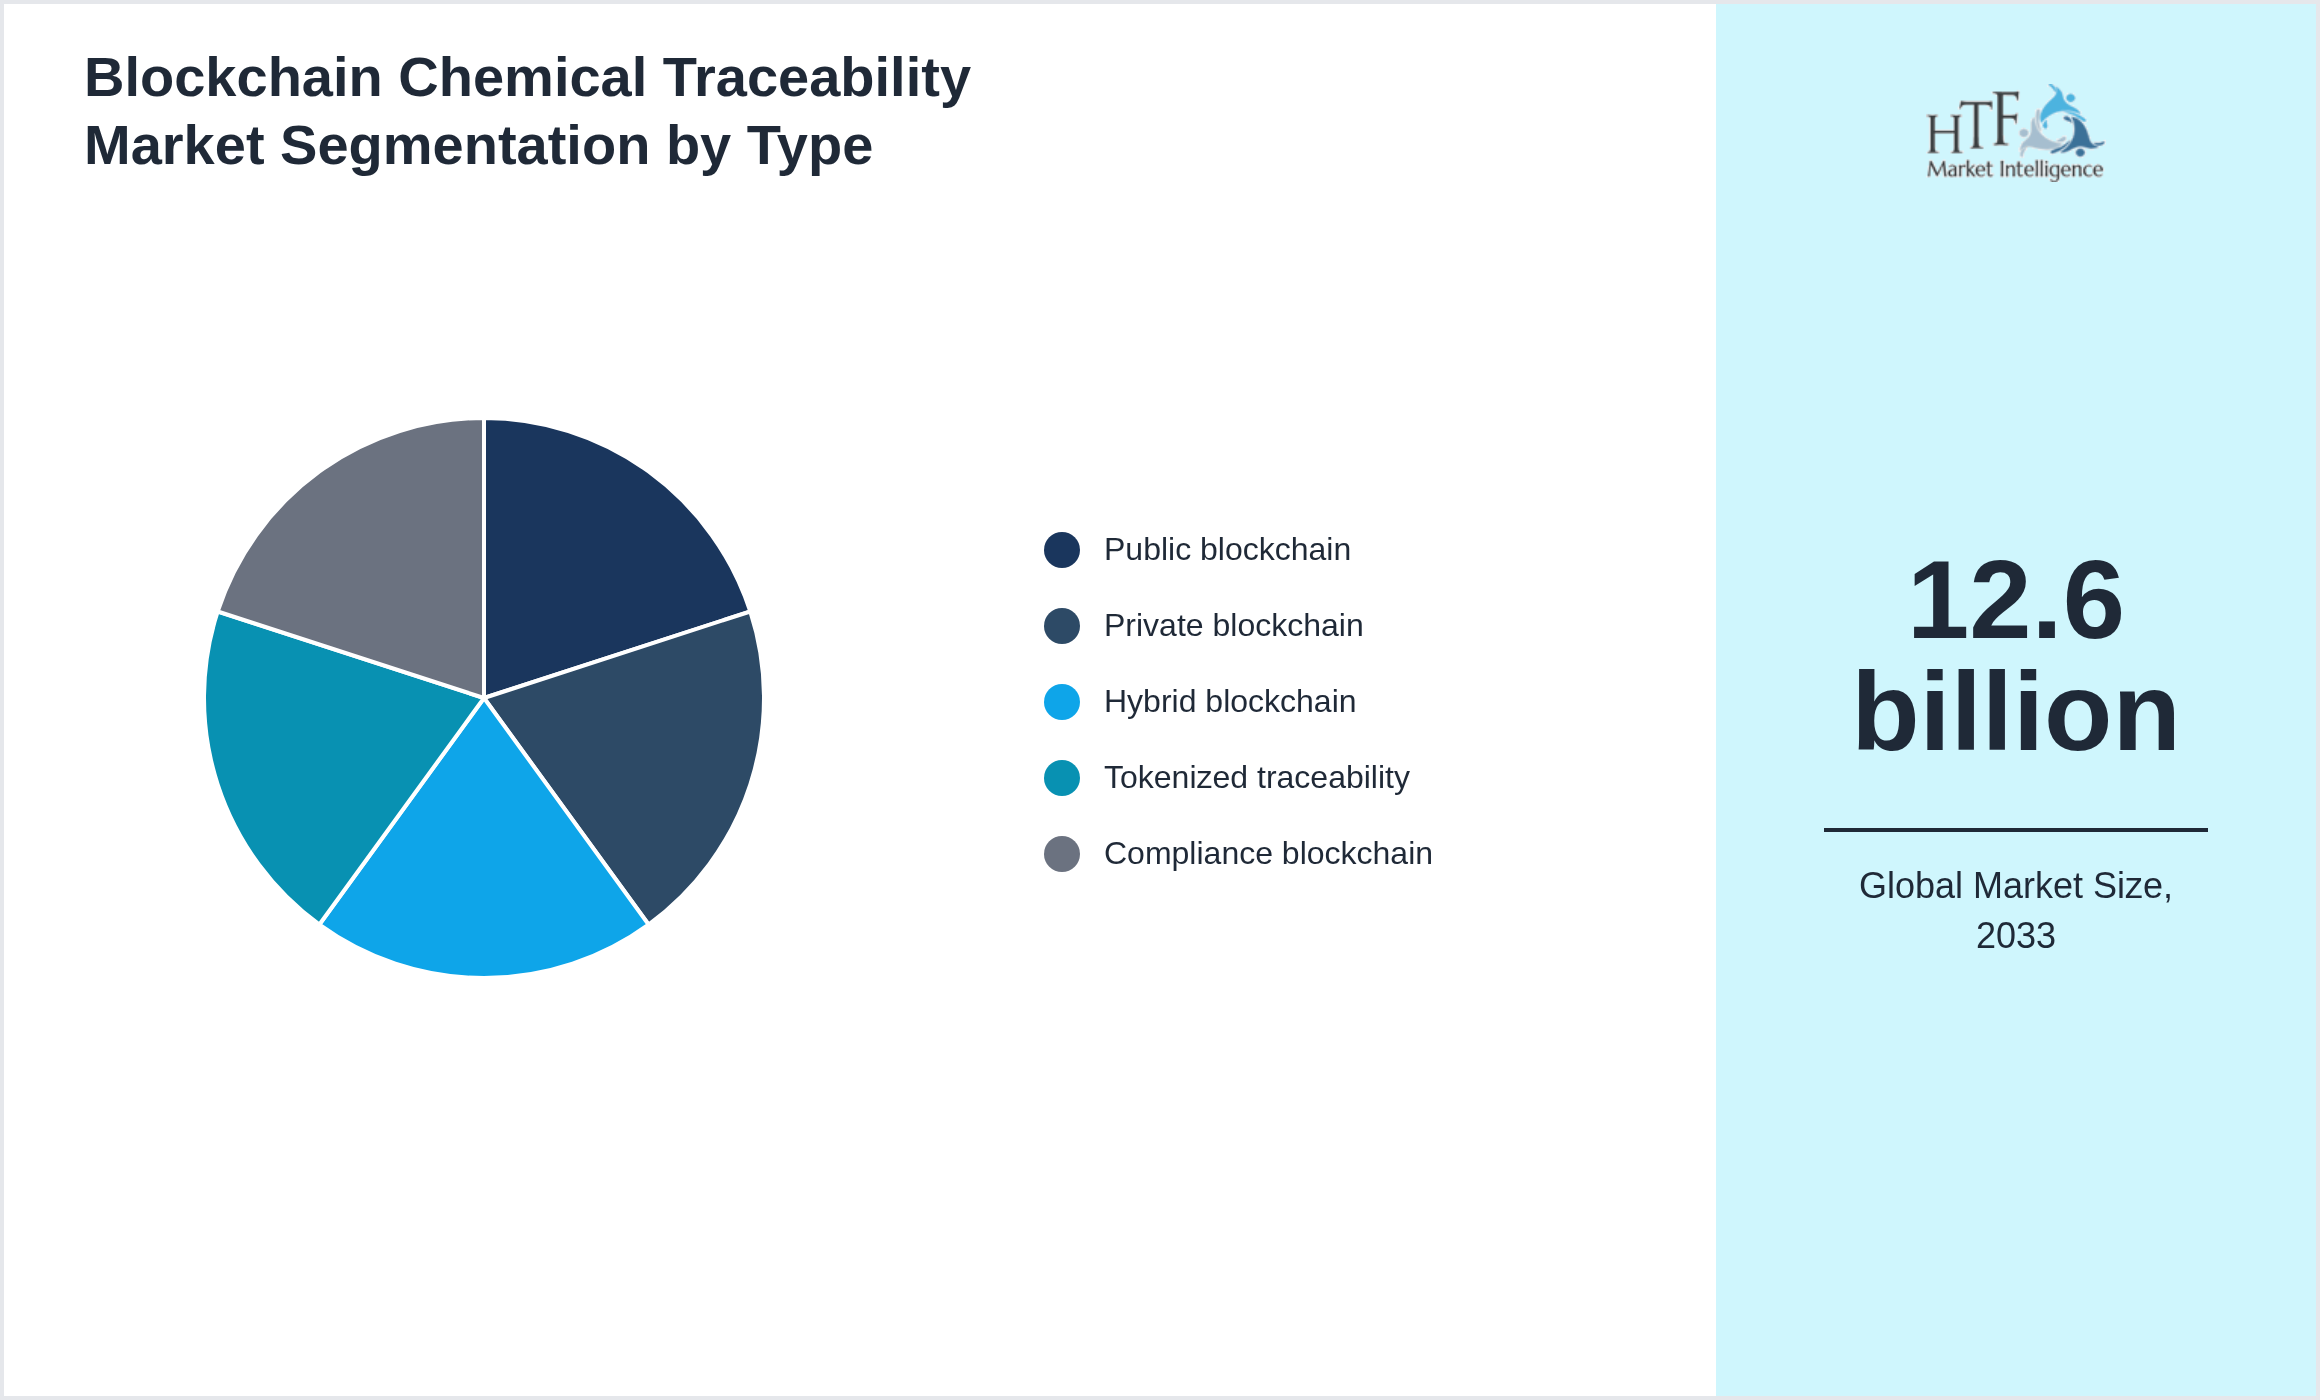
The Blockchain Chemical Traceability is growing at 18.70% and is expected to reach 12.6 billion by 2033. Below are some of the dynamics shaping the Blockchain Chemical Traceability.
Blockchain chemical traceability creates immutable, transparent records of chemical origin, handling, safety, and compliance. It ensures product authenticity, sustainability verification, and regulatory compliance across global supply chains. Europe leads due to strict chemical regulations; Asia Pacific grows fastest through export-driven adoption.
Source: HTF Market Intelligence (HTF MI)

A Blockchain Chemical Traceability market research report effectively communicates vital insights through several key aspects. It begins with an executive summary that concisely outlines the findings, conclusions, and actionable recommendations, allowing stakeholders to quickly grasp essential information. Clearly stating the research objectives ensures the purpose and specific questions being addressed are understood. The methodology section describes the research methods employed, such as surveys or focus groups, and provides a rationale for their selection to establish credibility. A market overview presents the industry landscape, including market size, growth trends, and key drivers.
Additionally, the segmentation analysis examines distinct market segments to identify varied customer needs. The competitive analysis offers insights into major competitors, highlighting their strengths and weaknesses. Finally, the report concludes with key findings and insights, followed by conclusions and recommendations that provide actionable strategies to guide future business decisions.
Geographic Analysis of Blockchain Chemical Traceability
The Blockchain Chemical Traceability market exhibits significant regional variation, shaped by different economic conditions and consumer behaviors.
Currently, Europe dominates the market due to high consumption, population growth, and sustained economic progress. Meanwhile, Asia Pacific is experiencing the fastest growth, driven by large-scale infrastructure investments, industrial development, and rising consumer demand.
- North America
- LATAM
- West Europe
- Central & Eastern Europe
- Northern Europe
- Southern Europe
- East Asia
- Southeast Asia
- South Asia
- Central Asia
- Oceania
- MEA
Blockchain Chemical Traceability Market Dynamics
Influencing Trend:
- • Product passports
- • Green blockchain audits
- • Carbon trace chains
- • Smart compliance
- • Tokenized logistics
- • Real-time chemical verification
- • Asia blockchain adoption
- • Digital certification
- • Supplier blockchain
- • Regulatory blockchain
Market Growth Drivers:
- • High need for chemical product integrity
- • Counterfeit prevention rising
- • Sustainability reporting rising
- • Compliance pressure rising
- • Green supply chain transparency rising
- • Global trade monitoring growing
- • APAC exports rising
- • Risk monitoring rising
- • Customer safety expectations rising
- • Digital transformation rising
Challenges:
- • Regulatory uncertainty
- • High integration cost
- • Limited enterprise skills
- • Data privacy concerns
- • Interoperability issues
- • Resistance to transparency
- • Slow industry adoption
- • System complexity
- • Cybersecurity risks
- • Vendor fragmentation
Opportunities:
- • Green chemical passports
- • Compliance automation
- • Asia export traceability
- • Brand ESG demands
- • Carbon-credit blockchains
- • Anti-counterfeit systems
- • Smart contracts
- • Digital identity systems
- • Real-time audits
- • Global chemical trade monitoring
Segmentation by Type
- • Public blockchain
- • Private blockchain
- • Hybrid blockchain
- • Tokenized traceability
- • Compliance blockchain
Segmentation by Application
- • Tracking
- • Certification
- • Hazardous goods
- • Sustainability audits
- • Drug chemicals

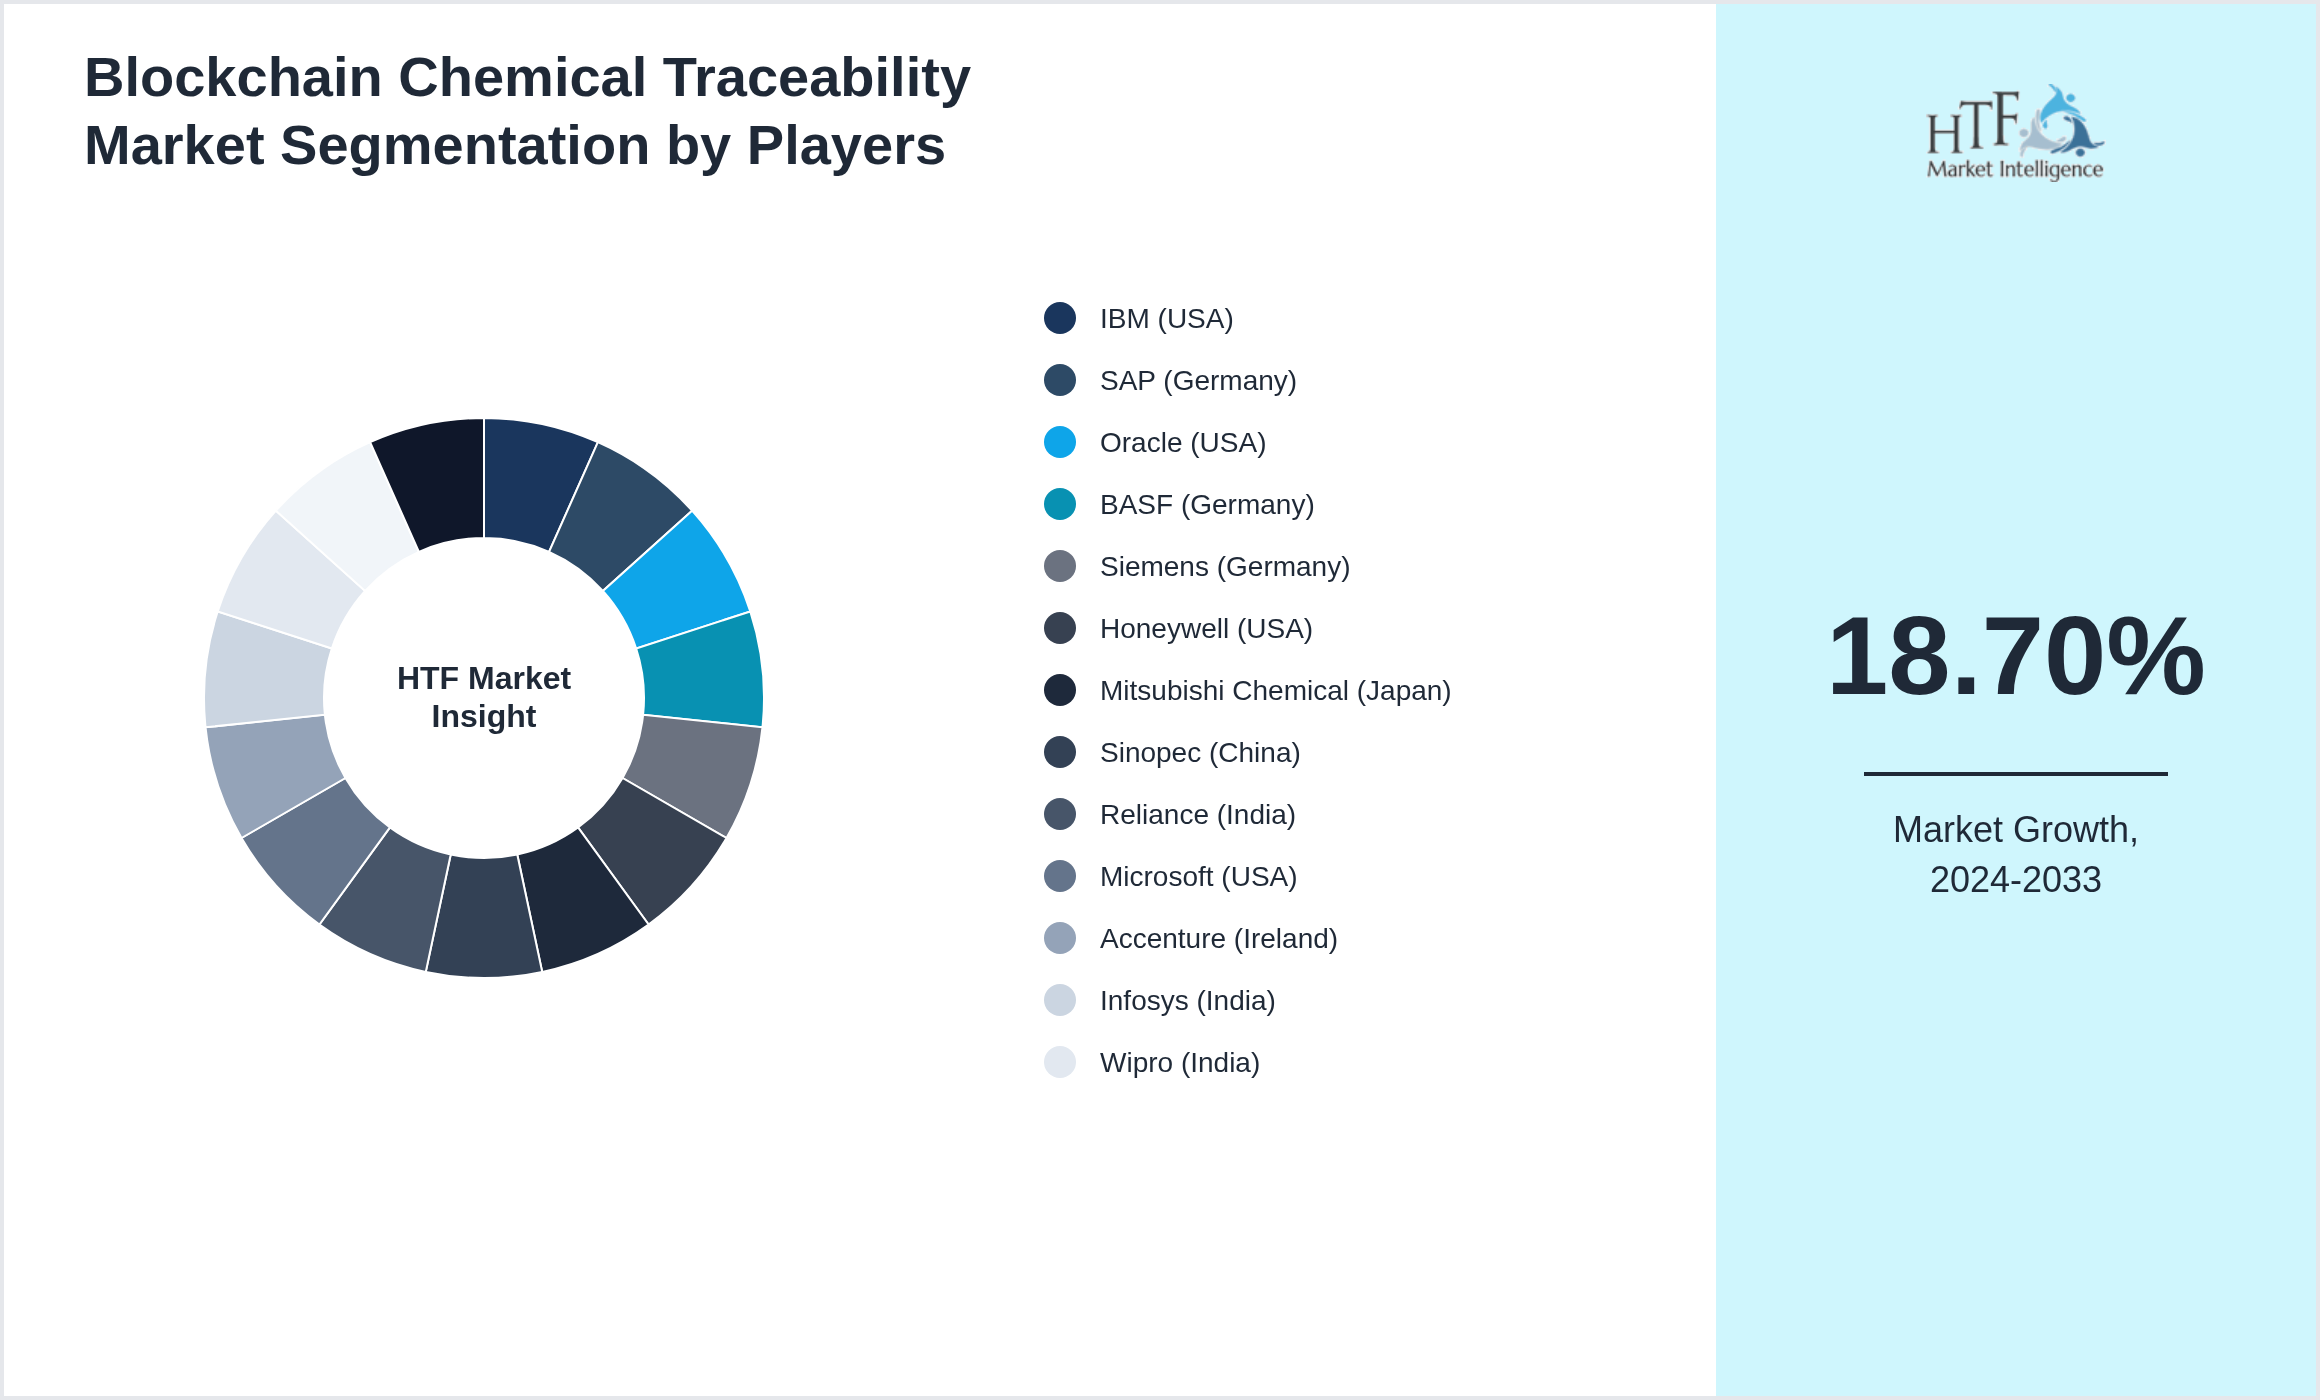
Key Players
The companies highlighted in this profile were selected based on insights from primary experts and an evaluation of their market penetration, product offerings, and geographical reach:
- • IBM (USA)
- • SAP (Germany)
- • Oracle (USA)
- • BASF (Germany)
- • Siemens (Germany)
- • Honeywell (USA)
- • Mitsubishi Chemical (Japan)
- • Sinopec (China)
- • Reliance (India)
- • Microsoft (USA)
- • Accenture (Ireland)
- • Infosys (India)
- • Wipro (India)
- • Chainalysis (USA)
- • VeChain (Singapore)
Regional Outlook
The Asia Pacific is the fastest-growing region due to its rapidly increasing population and expanding economic activities across various industries. This growth is further fueled by rising urbanization, improving infrastructure, and government initiatives aimed at fostering industrial development. Additionally, the region's young and dynamic workforce, along with an increase in consumer spending, contributes significantly to its accelerated growth rate. The Europe is the dominating region and is going to maintain its dominance during the forecasted period.
- North America
- LATAM
- West Europe
- Central & Eastern Europe
- Northern Europe
- Southern Europe
- East Asia
- Southeast Asia
- South Asia
- Central Asia
- Oceania
- MEA
Among the major investors, Johnson & Johnson is a prominent player. The company consistently allocates significant resources to expand its research capabilities, develop new medical technologies, and enhance its pharmaceutical portfolio. Johnson & Johnson's investments in R&D, coupled with strategic acquisitions and partnerships, reinforce its position as a major contributor to advancements in healthcare. This focus on innovation and market expansion underscores the critical importance of the North American region in the global healthcare landscape.
Source: HTF Market Intelligence (HTF MI)
For the complete company list, please ask for sample pages.
Competitive Landscape
The competitive landscape of the market provides a comprehensive analysis of the key players and their market positioning. It identifies the leading companies, including both established firms and emerging competitors, outlining their strengths such as innovation, strong brand presence, and extensive customer base, as well as weaknesses like limited product range or geographic reach. This section also delves into how these competitors position themselves in the market, whether they target premium, mid-tier, or budget segments, and how they differentiate from others through pricing, product innovation, or customer service.
Additionally, it highlights significant strategic moves, such as mergers, acquisitions, or product launches, that have impacted their competitive standing. The role of technology and innovation is another key factor, with companies investing in research and development to stay ahead. By understanding this competitive landscape, businesses can better identify market opportunities, anticipate competitor strategies, and adjust their approaches to gain a stronger foothold.
Research Methodology & Data Triangulation
Data triangulation is a robust research method that enhances the credibility and validity of findings by combining multiple data sources, methodologies, or perspectives. This approach involves three primary types: data source triangulation, where information is gathered from different sources such as surveys, interviews, and secondary data; methodological triangulation, which integrates various research methods, such as qualitative and quantitative techniques, to enrich the analysis; and investigator triangulation, where multiple researchers collaborate to interpret data, minimizing individual bias.
By employing data triangulation, businesses can gain a more comprehensive understanding of market dynamics and consumer behavior. This method helps validate findings by cross-referencing information, ensuring that conclusions are not based on a single data point. Consequently, triangulation enhances decision-making processes, as organizations can rely on more accurate and reliable insights. Ultimately, this approach fosters confidence in strategic planning and contributes to more effective risk management and resource allocation.
Key Development Activities
Merger & Acquisition
Market Estimation Process
Report Details
| Report Features | Details |
| Base Year | 2024 |
| Based Year Market Size (2024) | 3.1 billion |
| Historical Period | 2020 to 2024 |
| CAGR (2024 to 2033) | 18.70% |
| Forecast Period | 2026 to 2033 |
| Forecasted Period Market Size (2033) | 12.6 billion |
| Scope of the Report | Public blockchain, Private blockchain, Hybrid blockchain, Tokenized traceability, Compliance blockchain, Tracking, Certification, Hazardous goods, Sustainability audits, Drug chemicals |
| Regions Covered | North America, LATAM, West Europe, Central & Eastern Europe, Northern Europe, Southern Europe, East Asia, Southeast Asia, South Asia, Central Asia, Oceania, MEA |
| Companies Covered | IBM (USA), SAP (Germany), Oracle (USA), BASF (Germany), Siemens (Germany), Honeywell (USA), Mitsubishi Chemical (Japan), Sinopec (China), Reliance (India), Microsoft (USA), Accenture (Ireland), Infosys (India), Wipro (India), Chainalysis (USA), VeChain (Singapore) |
| Customization Scope | 15% Free Customization |
| Delivery Format | PDF and Excel through Email |
Limitation & Assumptions
Limitations and assumptions in a market research report are critical for framing the context and reliability of the findings. Limitations refer to potential weaknesses or constraints that may impact the research outcomes. These can include a limited sample size, which may not represent the broader population, or reliance on self-reported data, which can introduce bias. Other limitations may involve geographical constraints, where findings may not be applicable outside the studied regions, or temporal factors, such as rapidly changing market conditions, that can render results less relevant over time.
Assumptions are foundational beliefs taken for granted in the research process. For instance, it may be assumed that respondents provided honest and accurate information or that market conditions remained stable during the research period. Acknowledging these limitations and assumptions helps stakeholders critically evaluate the validity of the report's conclusions and guides strategic decisions based on the inherent uncertainties of the research.
Research enthusiast focused on transforming data uncovering into actionable insights through data-driven decision-making.